---
title: Curve Fitting with Linear and Nonlinear Regression
description: We often think of a relationship between two variables as a straight line. That is, if you increase the predictor by 1 unit, the response always increases by X units. However, not all data have a linear relationship, and your model must fit the curves present in the data.
image: https://blog.minitab.com/hubfs/B2BML%20-%20NEW%20FILE%20MANAGER%20STRUCTURE/Blog%20Images/Imported_Blog_Media/flp_linear-3.gif
---
English
- [English](https://blog.minitab.com/en/?hsLang=en)
- [Français](https://blog.minitab.com/fr/?hsLang=en)
- [Deutsch](https://blog.minitab.com/de/?hsLang=en)
- [Português](https://blog.minitab.com/pt/?hsLang=en)
- [Español](https://blog.minitab.com/es/?hsLang=en)
- [日本語](https://blog.minitab.com/ja/?hsLang=en)
- [한국어](https://blog.minitab.com/ko/?hsLang=en)
- [中文(简体)](https://blog.minitab.com/zh/?hsLang=en)
- [English](https://blog.minitab.com/en/blog/adventures-in-statistics-2/curve-fitting-with-linear-and-nonlinear-regression)
- [Português](https://blog.minitab.com/pt/blog/ajuste-de-curva-com-regressao-linear-e-nao-linear)
- [ Partners](https://www.minitab.com/en-us/company/partners/)
- [ Contact](https://www.minitab.com/en-us/company/contact-us/)
- [ Talk to Minitab](https://www.minitab.com/en-us/talk-to-minitab/)
- [ My Account](https://licensing.minitab.com/account/manage)
[](https://www.minitab.com/en-us/)
- Products
Back
[Products](https://www.minitab.com/en-us/products/)
[All Products](https://www.minitab.com/en-us/products/)
- [Minitab Solution Center](https://www.minitab.com/en-us/products/minitab-solution-center/)
- [Minitab Statistical Software](https://www.minitab.com/en-us/products/minitab/)
- [Minitab Connect](https://www.minitab.com/en-us/products/connect/)
- [Minitab Model Ops](https://www.minitab.com/en-us/products/model-ops/)
- [Minitab Education Hub](https://www.minitab.com/en-us/products/education-hub/)
- [Minitab Engage](https://www.minitab.com/en-us/products/engage/)
- [Minitab Workspace](https://www.minitab.com/en-us/products/workspace/)
- [Real-Time SPC](https://www.minitab.com/en-us/products/real-time-spc/)
- [Prolink Data Collection & SPC](https://www.minitab.com/en-us/products/prolink)
- [Simul8 Discrete Event Simulation](https://info.minitab.com/en/new-to-simul8?hsLang=en)
- [SPM](https://www.minitab.com/en-us/products/spm/)
- Solutions
Back
[Solutions](https://www.minitab.com/en-us/solutions/)
[All Solutions](https://www.minitab.com/en-us/solutions/)
- [Analytics](https://www.minitab.com/en-us/solutions/analytics/)
- [Statistics & Predictive Analytics](https://www.minitab.com/en-us/solutions/analytics/statistical-analysis-predictive-analytics/)
- [Data Science & Machine Learning](https://www.minitab.com/en-us/solutions/analytics/data-science-machine-learning/)
- [Business Analytics & Intelligence](https://www.minitab.com/en-us/solutions/analytics/business-analytics-intelligence/)
- [Statistical Process Control](https://www.minitab.com/en-us/solutions/analytics/statistical-process-control/)
- [Quality Analytics](https://www.minitab.com/en-us/solutions/analytics/quality-analytics/)
- [Live Analytics](https://www.minitab.com/en-us/solutions/analytics/live-analytics/)
- [Reliability & Life Data Analysis](https://www.minitab.com/en-us/solutions/analytics/reliability/)
- [Discrete Event Simulation](https://info.minitab.com/en/new-to-simul8?hsLang=en)
- [Process Mining](https://info.minitab.com/en/new-to-simul8?hsLang=en)
- [Key Capabilities](https://www.minitab.com/en-us/solutions/key-capabilities/)
- [Continuous Improvement](https://www.minitab.com/en-us/solutions/key-capabilities/continuous-improvement/)
- [Data Integration & Data Prep](https://www.minitab.com/en-us/solutions/key-capabilities/data-integration-data-prep/)
- [Diagramming & Mind Mapping](https://www.minitab.com/en-us/solutions/key-capabilities/diagramming-mind-mapping/)
- [Digital Twins](https://info.minitab.com/en/new-to-simul8?hsLang=en)
- [Model Deployment & ML Ops](https://www.minitab.com/en-us/solutions/key-capabilities/model-deployment-ml-ops/)
- [Innovation & Project Management](https://www.minitab.com/en-us/solutions/key-capabilities/innovation-project-management/)
- [Process Excellence: Detect, Correct & Prevent](https://www.minitab.com/en-us/solutions/key-capabilities/process-excellence/)
- [Featured Industries](https://www.minitab.com/en-us/solutions/industry/)
- [Academic](https://www.minitab.com/en-us/solutions/industry/academic/)
- [Energy & Natural Resources](https://www.minitab.com/en-us/solutions/industry/energy-resources/)
- [Government & Public Sector](https://www.minitab.com/en-us/solutions/industry/government/)
- [Healthcare](https://www.minitab.com/en-us/solutions/industry/healthcare/)
- [Insurance](https://www.minitab.com/en-us/solutions/industry/insurance/)
- [Manufacturing & Industrial](https://www.minitab.com/en-us/solutions/industry/manufacturing-industrial/)
- [Services](https://www.minitab.com/en-us/solutions/industry/service-industries/)
- [Software & Technology](https://www.minitab.com/en-us/solutions/industry/software-technology/)
- [Construction](https://www.minitab.com/en-us/solutions/industry/construction/)
- [Featured Roles](https://www.minitab.com/en-us/solutions/role/)
- [Engineering](https://www.minitab.com/en-us/solutions/role/engineering/)
- [Business Analysis](https://www.minitab.com/en-us/solutions/role/business-analysts/)
- [Information Technology](https://www.minitab.com/en-us/solutions/role/information-technology/)
- [Supply Chain](https://www.minitab.com/en-us/solutions/role/supply-chain/)
- [Customer Service & Contact Center](https://www.minitab.com/en-us/solutions/role/customer-service-contact-center/)
- [Human Resources](https://www.minitab.com/en-us/solutions/role/human-resources/)
- [Marketing](https://www.minitab.com/en-us/solutions/role/marketing/)
- [Research and Development](https://www.minitab.com/en-us/solutions/role/research-and-development/)
- Resources & Services
Back
[Resources & Services](https://www.minitab.com/en-us/resources-services/)
[All Resources & Services](https://www.minitab.com/en-us/resources-services/)
- [Resources](https://www.minitab.com/en-us/resources-services/resources/)
- [Case Studies](https://www.minitab.com/en-us/resources-services/resources/case-studies/)
- [eBooks & White Papers](https://www.minitab.com/en-us/resources-services/resources/ebooks-and-white-papers/)
- [Blog](https://blog.minitab.com/blog/?hsLang=en)
- [Data Sets](https://www.minitab.com/en-us/resources-services/resources/data-set/)
- [Webinars & Events](https://www.minitab.com/en-us/resources-services/resources/events/)
- [Education Hub](https://www.minitab.com/en-us/resources-services/resources/education-hub/)
- [Services](https://www.minitab.com/en-us/resources-services/services/)
- [Training](https://www.minitab.com/en-us/resources-services/services/training/)
- [Deployment](https://www.minitab.com/en-us/resources-services/services/deployment/)
- [Consulting](https://www.minitab.com/en-us/resources-services/services/statistical-consulting/)
- [Self-Paced Learning](https://www.minitab.com/en-us/resources-services/services/self-paced-learning/)
- [Continuing Education](https://www.minitab.com/en-us/resources-services/services/continuing-education/)
- Support
Back
[Support](https://www.minitab.com/en-us/support/)
[Technical Support](https://www.minitab.com/en-us/support/)
- [Subscriptions & Activation](https://www.minitab.com/en-us/support/subscriptions-and-activation/)
- [Minitab Quick Start](https://www.minitab.com/en-us/support/quick-start/)
- [Training](https://www.minitab.com/en-us/resources-services/services/training/)
- [Installation Support](https://www.minitab.com/en-us/support/installation/)
- [Support Videos](https://www.minitab.com/en-us/support/videos/)
- [Support Documentation](https://www.minitab.com/en-us/support/documents/)
- [Software Updates](https://www.minitab.com/en-us/support/software-updates/)
- [Product Downloads](https://www.minitab.com/en-us/support/downloads/)
- [Support Policy](https://www.minitab.com/en-us/support/policy/)
- Company
Back
[Company](https://www.minitab.com/en-us/company/)
[Company](https://www.minitab.com/en-us/company/)
- [About Us](https://www.minitab.com/en-us/company/our-company/)
- [Leadership Team](https://www.minitab.com/en-us/company/leadership-team/)
- [Partners](https://www.minitab.com/en-us/company/partners/)
- [Careers](https://www.minitab.com/en-us/company/careers/)
- [Contact](https://www.minitab.com/en-us/company/contact-us/)
- [News](https://www.minitab.com/en-us/company/press-releases/)
[Try/Buy](https://www.minitab.com/en-us/try-buy/)
- [Statistics](https://blog.minitab.com/en/blog/tag/statistics)
- [Data Analysis](https://blog.minitab.com/en/blog/tag/data-analysis)
-
- [Quality Improvement](https://blog.minitab.com/en/blog/tag/quality-improvement)
- [Subscribe](https://info.minitab.com/blog/subscribe?hsLang=en)

## Notice
You are now leaving minitab.com.
Click Continue to proceed to:
Continue
Go Back
# Curve Fitting with Linear and Nonlinear Regression
Minitab Blog Editor | 8/22/2013
Topics: [Regression Analysis](https://blog.minitab.com/en/blog/tag/regression-analysis)
- [Share](https://www.linkedin.com/shareArticle?mini=true&url=https://blog.minitab.com/en/blog/adventures-in-statistics-2/curve-fitting-with-linear-and-nonlinear-regression)
- [Share](https://www.facebook.com/sharer.php?u=https://blog.minitab.com/en/blog/adventures-in-statistics-2/curve-fitting-with-linear-and-nonlinear-regression)
We often think of a relationship between two variables as a straight line. That is, if you increase the predictor by 1 unit, the response always increases by X units. However, not all data have a linear relationship, and your model must fit the curves present in the data.
This fitted line plot shows the folly of using a line to fit a curved relationship!
How do you fit a curve to your data? Fortunately, [Minitab Statistical Software](http://www.minitab.com/en-us/products/minitab/) includes a variety of curve-fitting methods in both linear regression and nonlinear regression.
To compare these methods, I’ll fit models to the somewhat tricky curve in the fitted line plot. For our purposes, we’ll assume that these data come from a low-noise physical process that has a curved function. We want to accurately predict the output given the input. Here are the [data](https://cdn2.content.compendiumblog.com/uploads/user/458939f4-fe08-4dbc-b271-efca0f5a2682/479b4fbd-f8c0-4011-9409-f4109cc4c745/File/e4ddd5ea80525c34a970d9b1887d04b7/curvature.MTW) to try it yourself!
## Fitting Curves with Polynomial Terms in Linear Regression
The most common way to fit curves to the data using linear regression is to include polynomial terms, such as squared or cubed [predictors](https://support.minitab.com/minitab/19/help-and-how-to/modeling-statistics/regression/supporting-topics/basics/what-are-response-and-predictor-variables/).
Typically, you choose the model order by the number of bends you need in your line. Each increase in the exponent produces one more bend in the curved fitted line. It’s very rare to use more than a cubic term.
| Linear | Quadratic | Cubic |
| --- | --- | --- |
| 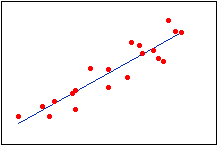 | 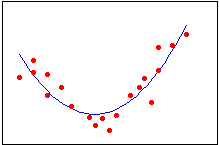 | 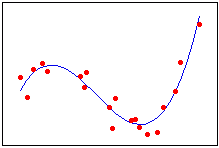 |
The graph of our data appears to have one bend, so let’s try fitting a quadratic linear model using **Stat > Fitted Line Plot**.
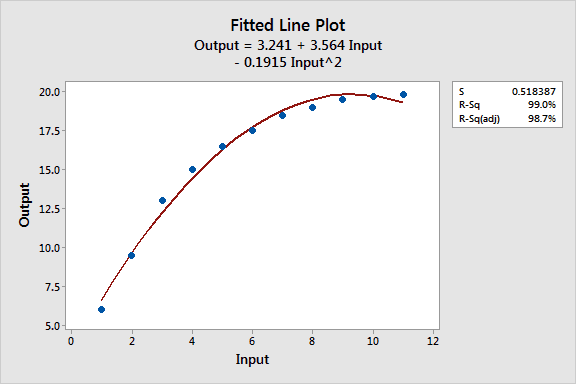
While the [R-squared](https://blog.minitab.com/blog/adventures-in-statistics/regression-analysis-how-do-i-interpret-r-squared-and-assess-the-goodness-of-fit?hsLang=en) is high, the fitted line plot shows that the regression line systematically over- *and* under-predicts the data at different points in the curve. This shows that you can’t always trust a high R-squared.
Let’s see if we can do better.
## Fitting Curves with Reciprocal Terms in Linear Regression
If your [response](https://support.minitab.com/minitab/19/help-and-how-to/modeling-statistics/regression/supporting-topics/basics/what-are-response-and-predictor-variables/) data descends down to a floor, or ascends up to a ceiling as the input increases (e.g., approaches an asymptote), you can fit this type of curve in linear regression by including the reciprocal (1/X) of one more predictor variables in the model. More generally, you want to use this form when the size of the effect for a predictor variable decreases as its value increases.
Because the slope is a function of 1/X, the slope gets flatter as X increases. For this type of model, X can never equal 0 because you can’t divide by zero.
Looking at our data, it does appear to be flattening out and approaching an asymptote somewhere around 20.
I used **Calc > Calculator** in Minitab to create a 1/Input column (InvInput). Let’s see how that works! I fit it with both a linear (top) and quadratic model (bottom).
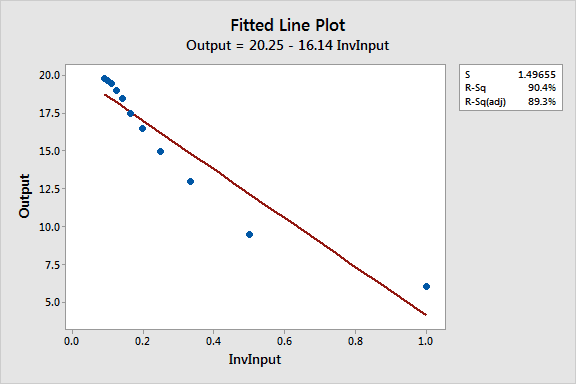
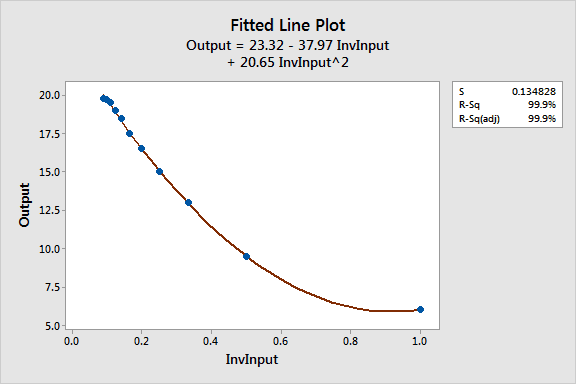
For this particular example, the quadratic reciprocal model fits the data much better. The fitted line plots change the x-axis to 1/Input, so it’s hard to see the natural curvature of the data.
In the scatterplot below, I used the equations to plot fitted points for both models in the natural scale. The green data points clearly fall closer to the quadratic line.
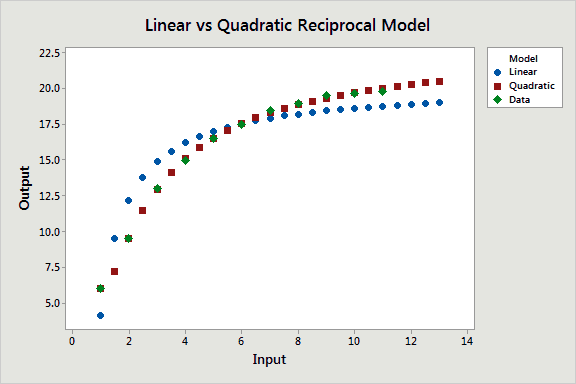
Compared to the quadratic model, the reciprocal model with the quadratic term has a lower S value (good), higher R-squared (good), and it doesn’t exhibit the biased predictions. So far, this is our best model.
## Transforming the Variables with Log Functions in Linear Regression
A log transformation is a relatively common method that allows linear regression to perform curve fitting that would otherwise only be possible in nonlinear regression.
For example, the nonlinear function:
Y=eB0X1B1X2B2
can be expressed in linear form of:
Ln Y = B0 + B1lnX1 + B2lnX2
You can take the log of both sides of the equation, like above, which is called the double-log form. Or, you can take the log of just one side, known as the semi-log form. If you take the logs on the predictor side, it can be for all or just some of the predictors.
Log functional forms can be quite powerful, but there are too many combinations to get into detail in this overview. The choice of double-log versus semi-log (for either the response or predictors) depends on the specifics of your data and subject area knowledge. In other words, if you go this route, you’ll need to do some research.
Let’s get back to our example. For data where the curve flattens out as the predictor increases, a semi-log model of the relevant predictor(s) can fit. Let’s try it!
Minitab’s fitted line plot conveniently has the option to log-transform one or both sides of the model. So I’ve transformed just the predictor variable in the fitted line plot below.
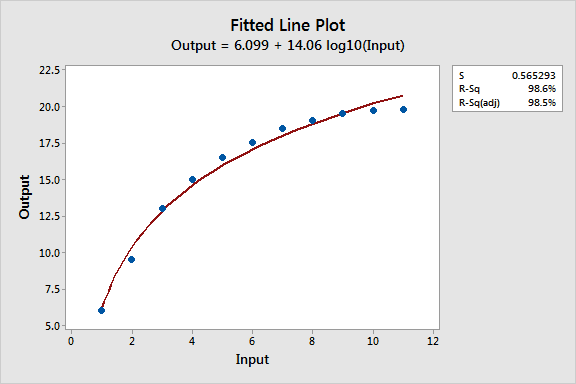
Visually, we can see that the semi-log model systematically over and under-predicts the data at different points in the curve, just like quadratic model. The S and R-squared values are also virtually identical to that model.
So far, the linear model with the reciprocal terms still provides the best fit for our curved data.
## Fitting Curves with Nonlinear Regression
[Nonlinear regression](https://blog.minitab.com/blog/adventures-in-statistics/linear-or-nonlinear-regression-that-is-the-question?hsLang=en) can be a powerful alternative to linear regression because it provides the most flexible curve-fitting functionality. The trick is to find the nonlinear function that best fits the specific curve in your data. Fortunately, Minitab provides tools to make that easier.
In the **Nonlinear Regression** dialog (**Stat > Regression > Nonlinear Regression**), enter *Output* for **Response**. Next, click **Use Catalog** to choose from the nonlinear functions that Minitab supplies.
We know that our data approaches an asymptote, so we can click on the two Asymptotic Regression functions. The concave version matches our data more closely. Choose that function and click **OK**.
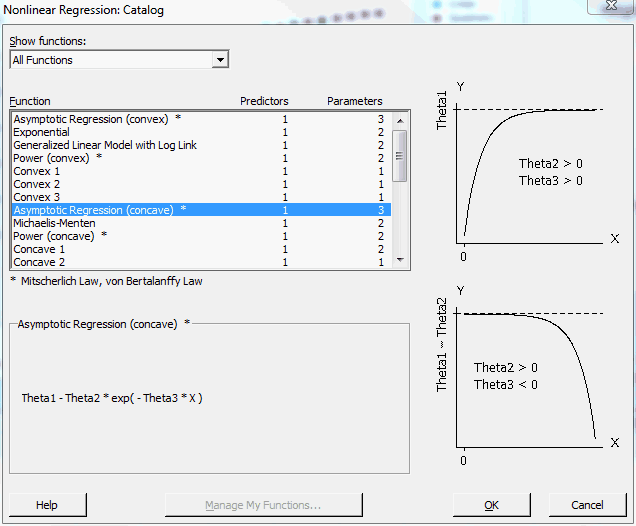
Next, Minitab displays a dialog where we choose our predictor.
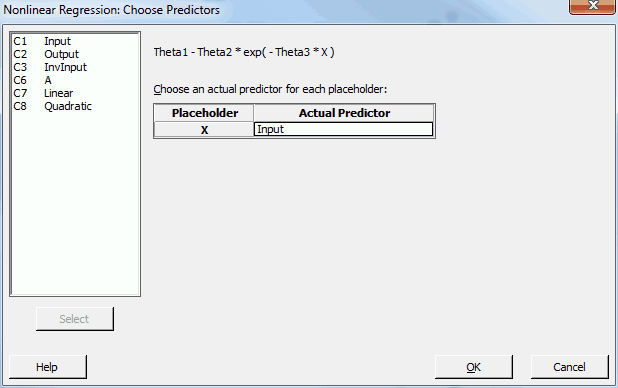
Enter *Input*, click **OK**, and we’re back at the main dialog.
If we click **OK** in the main dialog, Minitab displays the following dialog:
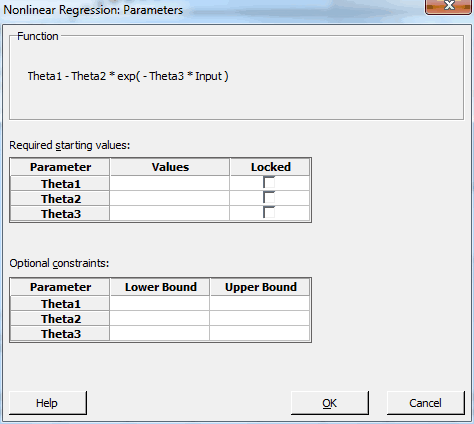
Unlike linear regression, nonlinear regression uses an algorithm to find the best fit step-by-step. We need to supply the starting values for each parameter in the function. Shoot, I don’t have any idea! Fortunately, Minitab makes it easy.
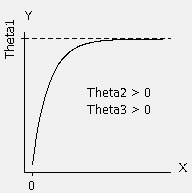Let’s look back at the function we chose. The picture makes it easier!
Notice that Theta1 is the asymptote, or the ceiling, that our data approaches. Judging by the initial scatterplot, that’s about 20 for our data. For a case like ours, where the response approaches a ceiling as the predictor increases, Theta2 > 0 and Theta3 > 0.
Consequently, I’ll enter the following in the dialog:
- Theta1: 20
- Theta2: 1
- Theta3: 1
After we enter these values, we go back to the main dialog, click **OK**, and voila!
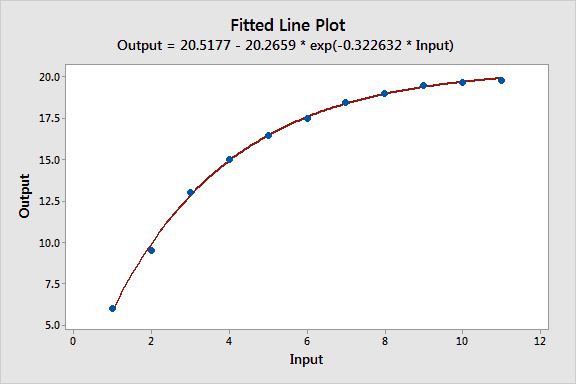
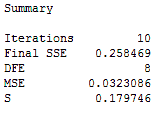
It’s [impossible to calculate R-squared for nonlinear regression](https://blog.minitab.com/blog/adventures-in-statistics/why-is-there-no-r-squared-for-nonlinear-regression?hsLang=en), but [the S value](https://blog.minitab.com/blog/adventures-in-statistics/regression-analysis-how-to-interpret-s-the-standard-error-of-the-regression?hsLang=en) for the nonlinear model (0.179746) is nearly as small as that for the reciprocal model (0.134828). You want a small S because it means the data points fall closer to the curved fitted line. The nonlinear model also doesn’t have a systematic bias.
## Comparing the Curve-Fitting Effectiveness of the Different Models
| **Model** | **R-squared** | **S** | **Biased fits** |
| --- | --- | --- | --- |
| Reciprocal - Quadratic | 99.9 | 0.134828 | No |
| Nonlinear | N/A | 0.179746 | No |
| Quadratic | 99.0 | 0.518387 | Yes |
| Semi-Log | 98.6 | 0.565293 | Yes |
| Reciprocal - Linear | 90.4 | 1.49655 | Yes |
| Linear | 84.0 | 1.93253 | Yes |
The linear model with the quadratic reciprocal term and the nonlinear model both beat the other models. These top two models produce equally good predictions for the curved relationship. However, the linear regression model with the reciprocal terms also produces p-values for the predictors (all significant) and an R-squared (99.9%), none of which you can get for a nonlinear regression model.
For this example, these extra statistics can be handy for reporting, even though the nonlinear results are equally valid. However, in cases where the nonlinear model provides the best fit, you should go with the better fit.
[What is the difference between linear and nonlinear regression equations?](https://blog.minitab.com/blog/adventures-in-statistics/what-is-the-difference-between-linear-and-nonlinear-equations-in-regression-analysis?hsLang=en)
## Closing Thoughts
If you have a difficult curve to fit, finding the correct model may seem like an overwhelming task. However, after all the effort to collect the data, it’s worth the effort to find the best fit possible.
When specifying any model, you should let theory and subject-area knowledge guide you. Some areas have standard practices and functions to model the data.
While you want a good fit, you don’t want to artificially inflate the R-squared with an overly complicated model. Be aware that:
- [R-squared can be misleading](https://blog.minitab.com/blog/adventures-in-statistics/regression-analysis-how-do-i-interpret-r-squared-and-assess-the-goodness-of-fit?hsLang=en)
- [Overly complicated models can produce misleading results](https://blog.minitab.com/blog/adventures-in-statistics/multiple-regession-analysis-use-adjusted-r-squared-and-predicted-r-squared-to-include-the-correct-number-of-variables?hsLang=en)
- [Check the residual plots to avoid misleading results](https://blog.minitab.com/blog/adventures-in-statistics/why-you-need-to-check-your-residual-plots-for-regression-analysis?hsLang=en) (I didn’t display them in this post but I did check them!)
If you're learning about regression, read my [regression tutorial](https://blog.minitab.com/blog/adventures-in-statistics/regression-analysis-tutorial-and-examples?hsLang=en)!
## You Might Also Like
[How One Hotel Used Data to Improve Guest Satisfaction](https://blog.minitab.com/en/blog/how-one-hotel-used-data-to-improve-guest-satisfaction?hsLang=en)
[Brainstorm](https://blog.minitab.com/en/blog/tag/brainstorm) | 9 Minute Read
[Enhancing Accelerated Underwriting Efficiency with Predictive Analytics](https://blog.minitab.com/en/blog/enhancing-accelerated-underwriting-efficiency-with-predictive-analytics?hsLang=en)
[Regression Analysis](https://blog.minitab.com/en/blog/tag/regression-analysis) | 3 Minute Read
[Predictive Analytics and Determining Patient Length of Stay at Time of Admission](https://blog.minitab.com/en/blog/predictive-analytics-and-determining-patient-length-of-stay-at-time-of-admission?hsLang=en)
[Regression Analysis](https://blog.minitab.com/en/blog/tag/regression-analysis) | 5 Minute Read
---
- [Careers](https://www.minitab.com/en-us/company/careers/)
- [Trust Center](https://www.minitab.com/en-us/trust-center/)
- [Suppliers](https://www.minitab.com/en-us/suppliers/)
- [Site Map](https://www.minitab.com/en-us/site-map/)
- [](https://www.linkedin.com/company/minitab/)
- [](https://www.facebook.com/Minitab/)
- [](https://www.youtube.com/user/MinitabInc)
- [](https://www.instagram.com/minitab/)
---
© 2025 Minitab, LLC. All Rights Reserved.
- [Terms of Use](https://www.minitab.com/en-us/legal/terms-of-use/)
- [Privacy Policy](https://www.minitab.com/en-us/legal/privacy-policy/)
- [Legal](https://www.minitab.com/en-us/legal/)
- Cookies Settings