


In Minitab, the Assistant menu is your interactive guide to choosing the right tool, analyzing data correctly, and interpreting the results. If you’re feeling a bit rusty with choosing and using a particular analysis, the Assistant is your friend!
Previously, I’ve written about the linear model features in Minitab. In this post, I’ll work through a multiple regression analysis example and optimize the response variable to highlight the new features in the Assistant.
Choose a Regression Analysis
As part of a solar energy test, researchers measured the total heat flux. They found that heat flux can be predicted by the position of the focal points. We’ll use the new features in the Assistant to correctly position the focal points.
I’ve used this example dataset for a previous post about prediction intervals. It now includes an additional variable to highlight the Assistant’s capabilities.
In Minitab, go to Assistant > Regression, and you’ll see the interactive decision tree. You can click the diamonds for more information about how to choose and for examples of the analyses.
We have three X variables (predictors) and want to fit a regression model and to optimize the response variable. Following the tree takes us to Optimize Response at the bottom right.
Our response variable is HeatFlux and the X variables are the East, South, and North focal points. From my previous post, we’ve determined that we want to target the heat flux value of 234, but the Assistant can also maximize or minimize the response. We’ll also have the Assistant help us check for interaction effects and curvature.
Click the Optimize Response button and fill in the dialog that appears with this information:
The Assistant takes our candidate X variables and produces a regression model using stepwise regression. Let's take a look at the reports that the Assistant provides.
Summary Report
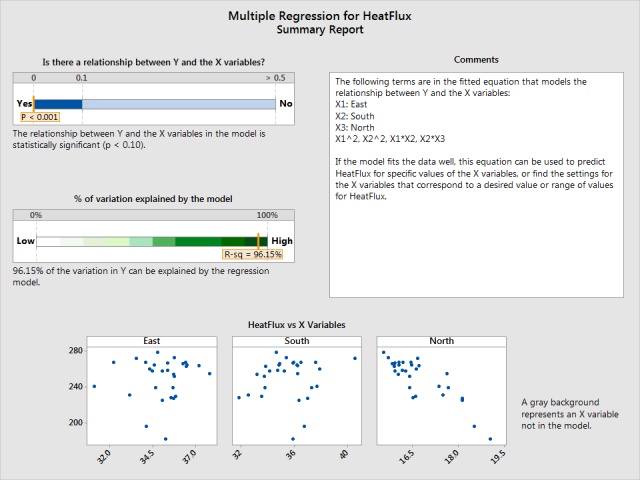
This Summary Report tells us that our regression model is statistically significant with a P value less than 0.001 and has an R-squared value of 96.15%. Great! The comments section indicates which variables were included in the model. In this case, the Assistant includes East, South and North, along with several polynomial terms to model curvature and several interaction terms.
Effects Report
The Effects Report graphically illustrates all of the interaction and main effects that are in the regression model. The lines are curved when the Assistant includes a polynomial term to fit a curve.
For example, the East*South interaction is significant, which indicates that the effect one variable has on heat flux depends on the setting of the other variable. If South is set at a low setting (31.84), increasing East reduces the heat flux. However, if south is at a high setting (40.55), increasing East increases the heat flux.
Diagnostic Report
The Diagnostic Report displays the residuals versus fitted values and identifies unusual points that we should investigate. Based on the criteria for large residuals, expect roughly 5% of the observations to be flagged as having a large residual. So, the two we have are not necessarily problematic. There are also two points with unusual X values. You can click the points to see which row they are in the worksheet.
Model Building Report
The Model Building Report shows the details about how the Assistant built the regression model, the regression equation, which variables contribute the most information, and whether the X variables are correlated with each other. North contributes the most information to this model. East is not significant but the Assistant includes it because it is part of a higher-order term.
The Assistant always watches your back. For example, when it builds your model, it uses standardized X variables because standardization removes most of the correlation between linear and higher-order terms, which reduces the chance of adding these terms unnecessarily. The final model is displayed in unstandardized (natural) units.
Prediction and Optimization Report
The Prediction and Optimization Report shows the Assistant’s solutions for obtaining our targeted value of 234. The optimal settings for the focal points are East 37.82, South 31.84, and North 16.01. For these settings, the models predicts a heat flux of 234 with a prediction interval of 216 to 252. The Assistant also provides alternate solutions for you to consider using your subject area expertise.
Report Card
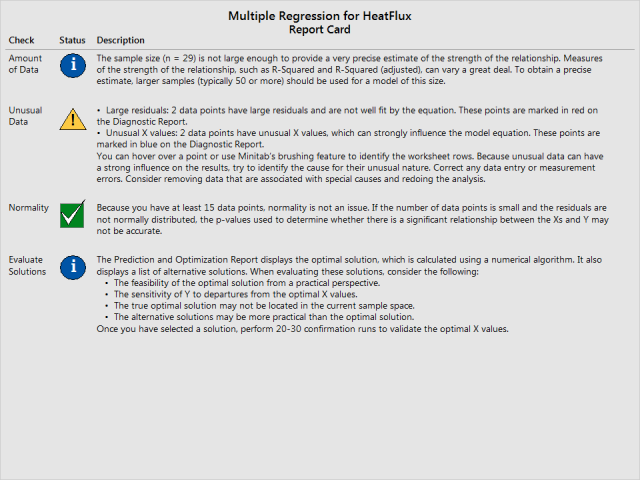
Finally, the Report Card prevents us from overlooking issues that could make the results unreliable. For example, we should collect a larger sample size and check the unusual residuals. Normality is not an issue for our data. And, there is a reminder that we should perform confirmation runs to validate the optimal values.
The methods used in the Assistant are based on established statistical practice and theory, referenced guidelines in the literature, and simulation studies performed by statisticians at Minitab. For details, read the technical white paper for Multiple Regression in the Assistant.
If you're just learning about regression, check out my regression tutorial!