
Trying to understand customer or patient behavior can be challenging. Oftentimes, researchers’ use survey data and frequently analyze it using regression in Minitab Statistical Software. But when the outcome variable is categorical rather than quantitative, interpreting the results of a logistic regression is not very straightforward or intuitive.
Another option for analyzing survey data in Minitab? Tap into the capabilities of CART®, Classification and Regression Trees, an illustrative tree-based, machine-learning technique that is now available in the latest version of Minitab Statistical Software.
What is CART?
CART is a decision tree algorithm that works by creating a set of yes or no rules that splits the target or outcome variable into partitions based on the predictor or input settings. The resulting model is presented as a decision tree that illustrates how the target or outcome variable was partitioned based on the input settings. Minitab’s CART algorithm automatically finds the optimal number of terminal nodes, also known as splits or final groupings, with the objective of maximizing the model’s predictive ability.
The best part? Once the analysis is complete, the output from CART has an intuitive visual interpretation, so you don’t have to be a data scientist to gain valuable insights from your data.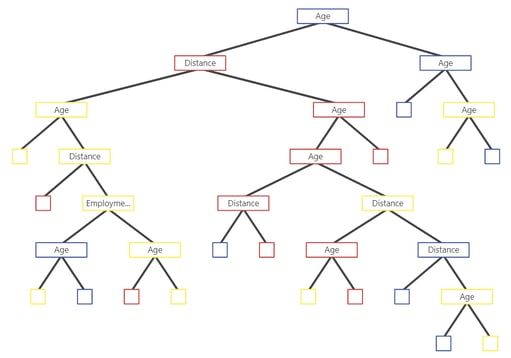
Note: Minitab displays a detailed CART tree by default. Right-click on the tree and choose Node Split View to see the condensed view above.

Capitalizing on Walk-in Clinic Data with CART
Now that we understand what CART is, let's see how it works.
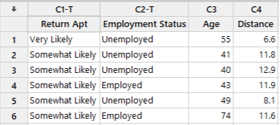
A walk-in clinic chain collected survey data from patients, asking how likely the patient was to use the clinic again in the future: Very Likely, Somewhat Likely or Unlikely. Staff also recorded the patient’s age, distance from home to clinic in miles and employment status. The clinic's regional manager was specifically interested in understanding the factors that affect walk-in patients’ likelihood of using the clinic’s services again.
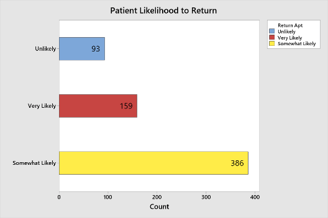
A subset of the data is shown on the right, along with a bar chart that represents the responses given by the clinic’s walk-in patients.
CART can be used to predict the likelihood of a categorical outcome, which in this case is the patient’s likelihood to return to the clinic. Minitab’s CART engine for classification offers an intuitive interface that can handle a binary outcome (two groups) or a multinomial outcome (three or more groups).
After the manager has entered her data into Minitab, she selects Stat > Predictive Analytics > CART® Classification and the following appears:
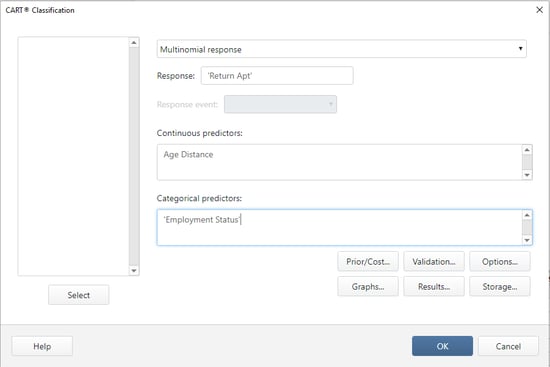
Since there are three or more groups, she selects Multinomial Response, followed by 'Return Apt' as the Response, or target she wanted to predict. She completes the box by quickly entering by the Continuous Predictors and the Categorical Predictors, or inputs she will use to make a prediction.
CART automatically handles missing values, is insensitive to extreme outliers and there are no assumptions about distributions, p-values or residuals to check, making CART easy to use, even for beginners. Additionally, Minitab’s CART feature carefully and deliberately partitions the data into two groups; part of the data will be used to build the model (Learn data), while the other data is used to evaluate how well the model can make new predictions (Test data).

The output from the CART analysis shows values of area under the (ROC) curve of 0.93 or higher for each target variable pair. The ROC helped the manager visualize how well her model could predict a patient’s likelihood of returning to the clinic. The graph shows the relationship between sensitivity (positives correctly predicted as positives) versus specificity (negatives correctly predicted as negatives).
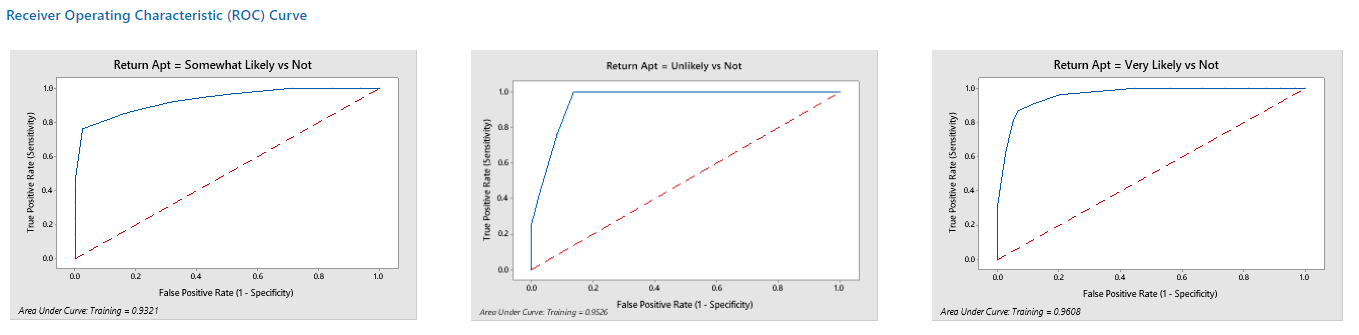
ROC values of 0.70 or higher are typically considered useful for most applications, so the manager was pleased to find a model that can so accurately predict the likelihood of patients returning to the clinic in the future.
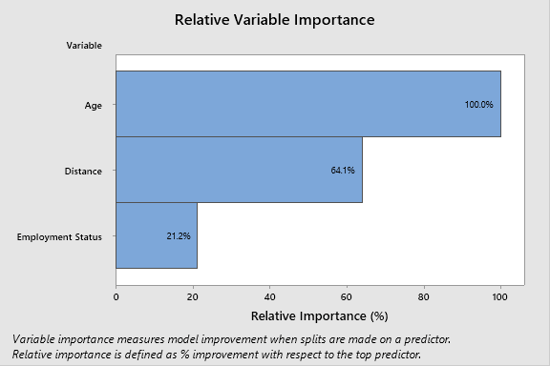
The manager had previously assumed that a patient’s distance from the clinic is the best predictor of a person’s likelihood of a return visit. Much to her surprise, that was not the case. CART’s Relative Variable Importance graph clearly shows the corresponding significance of each predictor in determining whether the patient will return to the clinic.
Final Findings
A quick evaluation of the variable importance graph above revealed that a patient’s age is the best predictor of their likelihood to use the clinic again, followed by distance, and finally, employment status.
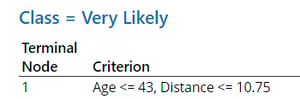 The insight gained into patient behavior helped the clinic’s regional manager create profiles for customers that are most likely to return to the clinic, so the center can provide additional literature and incentives to ensure their return. For example, patients below the age of 43 that live less than 11 miles from the clinic are very likely to return, regardless of employment status. Patients under 82, but older than 71 are somewhat likely to return, regardless of distance or employment status. In contrast, those aged between 67 to 71 are unlikely to return if they live more than 11 miles from the clinic, regardless of other factors.
The tree-based machine learning algorithms in Minitab Statistical Software have a wide range of applications and may help find answers to business problems in your organization. If you haven’t already, we invite you to start your free 30-day trial of Minitab today!
Discover CART for yourself