


No matter how experienced you are at analyzing data, communicating about your results can be a tremendous challenge. So it's not surprising that "Effectively Reporting Your Data Analysis" was one of the best-attended sessions at the inaugural Minitab Insights Conference last month.
The presenters, Benjamin Turcan and Jennifer Berner of First Niagara Bank, have a great deal of experience improving efficiency and enhancing revenue at their organization. They've also mentored many new data analysts and helped them learn how to present the findings from their analyses. In their presentation, they raised 5 questions that can help analysts communicate more effectively.
1. Who are you talking to?
The importance of knowing your audience was a central point of their presentation. When you deliver information, whether as a written document or as a presentation, it's important to tailor it. Berner pointed out that we do that naturally when we talk to people.
For example, suppose you're in an auto accident. The call to your family might go like this: "Hey, I was in an accident. Don't worry, I'm fine, but I'm going to be late for the picnic."
You also need to call your insurance company. The agent will want to know if anyone was harmed, but doesn't need to know you'll be late for the picnic. (Nor that you didn't really want to go to the picnic anyway.) She will need specifics about the cause of the accident, the contact information for the other driver, the license plate of the other car, etc.
Your presentation is different for your family and for the insurance company. You tailor the information to suit each audience's needs and concerns. The same should be true when you present the results of your analysis. Think about who your audience is, what information is most relevant to them, and how best to deliver that information so they will have the best chance of understanding it quickly.
To get further into this mindset, answer these specific questions about your audience.
2. How much do they know about what you're analyzing?
One thing is for sure—your audience doesn't know as much about your analysis as you do. In the session, Berner pointed out:
"You know that content inside and out, backwards and forwards because you've lived it for so long. But the people you are speaking to or writing to won't know that content as well as you do."
That means you need to look at the information with a fresh pair of eyes. How much of what you know do they need to know?
Imagine a friend calls to tell you he was in an accident. You know nothing about the accident until he tells you. You might assume that he was driving his usual car, but you don't know that until he confirms it. Maybe he borrowed a friend's car. Maybe he borrowed your car! (You knew you should never have lent him that key.) If so, he'll be tailoring that information very, very carefully.
Similarly, if you've been analyzing a part-making process and you're reporting your findings to the employees who actually make the parts every day, it's probably safe to assume they're going to intimately understand and care about every step of that process. You may need to share the detailed analysis you performed for each task. But your report to the C-level executives may require only a summary that provides the bottom line, quickly.
3. How much do they understand about analysis and statistics?
Stop me if you've heard this one. An insurance agent calls a customer and says, "Sorry sir, but your car was a total loss." To which the customer responds testily, "No it wasn't! I got several good years out of that car." The customer didn't understand that in the vernacular of the auto insurance industry "total loss" means something very specific—that repairing the car would cost more than its value before the accident.
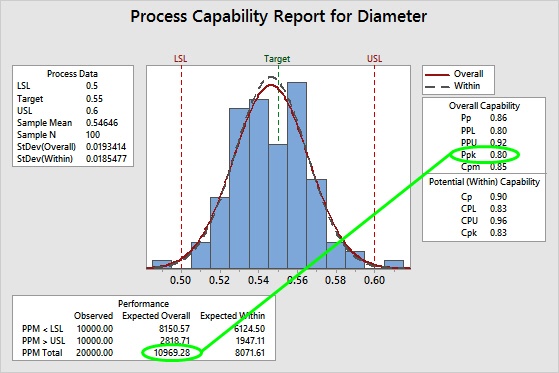
Similarly, when reporting statistical results, think about what the audience understands and what they do not. For example, if your audience is not familiar with capability analysis, reporting that Ppk was 0.80 probably won't be clear. ("Is that good?") Instead, you could say the data suggest there are about 11,000 defective parts for each million that you create. (That's a rounded value for the expected "overall" PPM [10969.28], as shown below.) Clearly, that's not good.
Keep in mind also that, just like other industries, statistics has its own vernacular that includes specialized meanings for very common words. Will your audience understand statistical jargon?
4. How will your audience react?

Suppose an ice cream truck strikes your vehicle. Your insurance agent explains that, because of the "Frozen Confections" clause in your policy, you're not covered. You're not going to be too happy. If the agent is smart, he'll be prepared to quote the specific part of the policy that lets them off the hook. (If you're smart, you'll start shopping for a different insurance company.)
Similarly, if you're reporting results that you know some people may not like, you should anticipate push-back and be ready to answers questions like, "Are you sure these data are valid?" or "Why should I believe you?" You may also want to look for ways to frame potentially negative information as an opportunity, rather than a problem.
5. Why should your audience care?
How will your audience use the information that you deliver? I once lost a car to a collision myself. When informed, my son used this information to lobby hard for his preferred replacement vehicle. I explained that while "Bugatti Veyron" is a really cool name for a car, we were going to look at cars with boring names, because I cared about the price more than the name.
Similarly if you want your analysis to spur an executive into action, you may want to work out some rough dollar figures about how much money the company stands to save. So in addition to reporting the number of defective parts, as we talked about above, you might also calculate that improving the process could save the company an estimated $250,000 in rework or scrapped parts annually.
Summary
You spent a lot of time and effort on your project and your data analysis, and sharing what you learned should be a rewarding culmination of those efforts. Taking some time to think about your audience and answer questions about what they need to know about your analysis will help ensure a better experience and better outcomes. Benjamin Turcan and Jennifer Berner's presentation at the Minitab Insights Conference provided a great reminder of how important these questions are!
Image credits: Credit for the original ice cream cone images (which I modified) goes to Jelene Morris. The car accident image that I modified can be found here.