


With apologies to Charles Dickens, I'd like to begin this post by summing up the Anderson-Darling statistic this way:
It was the best of fits, it was the worst of fits, it was the test of normality, it was the test for non-normality, it was the plot of belief, it was the plot of incredulity, it was the p-value of Light, it was the p-value of Darkness, it was the spring of hope, it was the winter of despair, we had everything before us, we had nothing before us...
I read and participate in discussions about a broad range of statistical topics daily, and few elicit as much misinformation combined with as many strong opinions as the issue of testing data for normality. So I'd like to provide some guidance on the issue by answering two key questions:
- Does my data need to be normal?
- How do I know if my data is normal?
So let's start with #1...
Does My Data Need to be Normal?
Most of us learned in various courses that normality is an assumption of many statistical tests. However, it is worth considering what "assumption" means in most of these cases, and you may be surprised. When developing a statistical test, statisticians will start with some basic assumptions that seem reasonable in the real world (for example, suppose I have samples from two independent, normally-distributed populations) and derive from that a formula for testing a hypothesis (i.e., does the mean of the first population differ from that of the second?), from which some known probabilities can be calculated.
The example I've laid out describes a 2-sample t-test, and under the assumptions given, a p-value can be calculated based on the t-distribution. Without those initial assumptions, there would be little from which to derive that test; additionally, by making those assumptions we are able to make a much more powerful test.
So from that explanation, we say that normality is an assumption of the 2-sample t-test. HOWEVER—and pay close attention here—although an assumption was made in order to develop that test, we do not know automatically whether or not that assumption not being met will result in the test being inaccurate! So, under the assumptions of a 2-sample t-test the results are accurate. But even in the absence of one or more assumptions the test may still be accurate, or at least accurate enough. To determine this, statisticians can use a variety of tools, including simulation, to evaluate how the test behaves in conditions that do not match the assumptions. (For extensive details on some examples, check out our our papers detailing methods used in Minitab's Assistant Menu.)
For now, we will concern ourselves only with the assumption of normality, and will outline when it is and is not important for the accuracy of a test. The table below lists many commonly-used tools for which normality is either an assumption, or is commonly believed to be an assumption, and groups them by their sensitivity to the data actually being normal:
| Normality very important | Capability Analysis (Normal) |
| Data should be generally normal | Residuals on most common linear models like Regression, GLM, DOE, etc. |
| Very robust to non-normal data | T-tests, ANOVA, control charts (unless data is extremely skewed and/or bounded at zero with many points near zero) |
How Do I Know If My Data Is Normal?
Here we return to the Anderson-Darling statistic, and the many contradictory statements I made at the top of this post, which are somehow all supposed to simultaneously be true. Most data analysts have found a situation where one of the following paradoxes is occurring:
- The data looks completely non-normal, but the p-value on the Anderson-Darling test is greater than .05.
- The data looks perfectly normal and we have plenty of data, but yet it still fails the Anderson-Darling test.
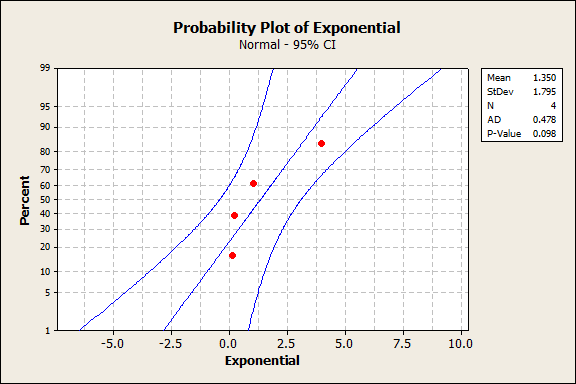
First, a high-level overview of what the Anderson-Darling test is and some things to keep in mind. It is a statistical test that looks for the absence of normality and indicates a significant lack of normality with a small p-value. Like any statistical test, it requires a certain amount of data to detect non-normality, and situation #1 above typically happens when there is very little data. Take 4 or 5 data points from even an extremely non-normal distribution, and you have a decent chance of it passing the test anyway:
Similarly, like other statistical tests, as you have more and more data, the Anderson-Darling test becomes more and more powerful, and it is important to consider not just statistical significance but also practical significance. Will a tiny departure from normality really affect your results? Let's consider two samples, shown below with overlaid histograms as well as on probability plots:
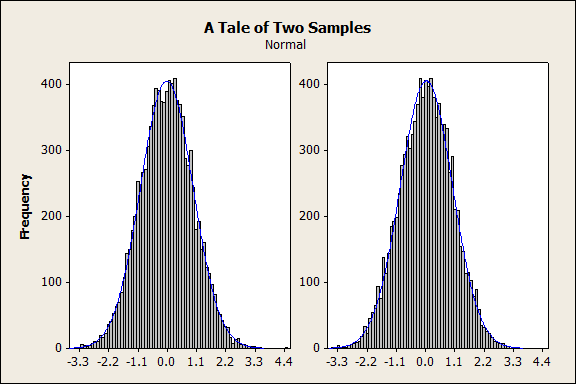
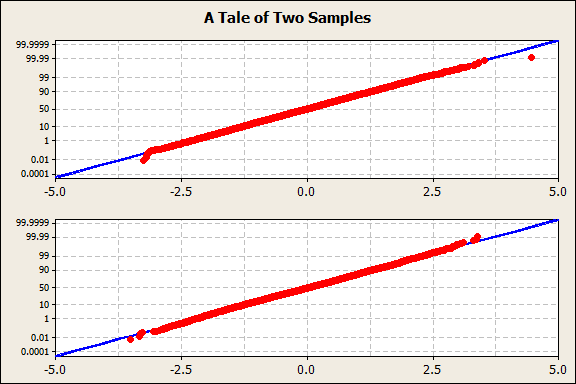
One of these samples has an Anderson-Darling p-value of 0.504 (not at all significant); the other's is 0.015 (highly significant). Which one passed and which one failed?
If you're wondering, then you have not yet grasped where I'm going with this.
Using the table in the first section, you may already have looked at this data and disregarded the need for normality for all but Capability Analysis (Normal). But should you even be concerned about your capability output? Here is a Capability Analysis of the two samples:
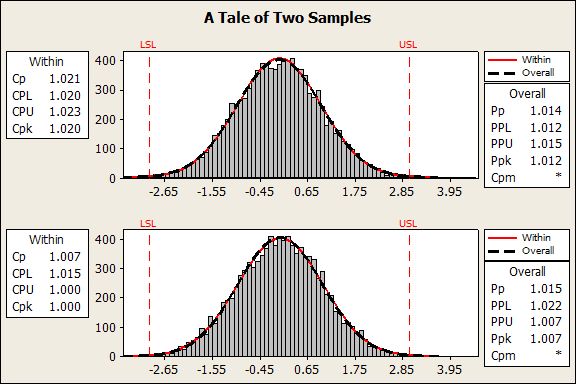
Not much difference in those statistics—certainly not enough to be concerned with. In other words, even with the most sensitive commonly-used tool, there comes a point where the Anderson-Darling test is too sensitive and you should trust your instincts.
With very little data, you may have difficulty getting a statistically significant result from the Anderson-Darling test, and with a large amount of data you are likely to get statistically significant results that aren't practically significant. So while Anderson-Darling is a useful test, it should only be used in conjunction with your instincts as well as your knowledge of whether the normality "assumption" is an important one for the test you are performing.
As for using our eyes on a histogram or probability plot in conjunction with the Anderson-Darling test to make a decision...
It is a far, far better plot that I view, than I have ever done; it is a far, far better test that I go to than I have ever known.