


Recently, Minitab News featured an article that talked about how to perform a Gage R&R Study with only one part. This prompted many users to contact our technical support team with questions about next steps, like these:
- What can I do with the output of a Gage study with only one part?
- How can I use the variance component estimates to obtain meaningful information about my measurement system?
By themselves, the variance component estimates from the ANOVA output for a Gage study with just one part are not particularly useful. However, if we combine what we’ve learned about the variance for Repeatability and Reproducibility with some additional information, we can obtain a significant amount of information about our measurement system. We will also need to do some simple hand calculations.
Getting Meaningful Information about the Measurement System
So, what other information will we need to get meaningful information about our measurement system?
If we have a historical estimate of the standard deviation for the Part-to-Part variation, we can get an estimate of the total variation and %Contribution. From there, we can work through a few hand calculations to obtain most of the information we would have obtained had we done a full Gage R&R.
We can also obtain some useful information about our measurement system if we use the process tolerance. Using the tolerance, we can get an estimate of the %Tolerance for the total gage (which is interpreted using the same guidelines as %Study Variation).
The way to proceed with the estimates of the historical StDev or the Tolerance is best explained with examples. Let’s assume that we’ve conducted a Gage study with one part and three operators by following the instructions in the article referenced above.
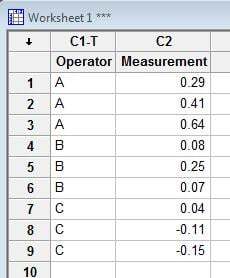
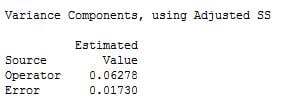
Let’s also assume that the data are arranged in the worksheet as shown below; the estimated variance components from the session window output are also shown below. The reproducibility is 0.06278 (the variance component for Operator), and the repeatability is 0.01730 (the variance component for Error).
 |
 |
Using Historical Part-to-Part Standard Deviation
As a first example, let’s assume that the historical standard deviation for part to part is 1.0853.
The total variation is the sum of the variance components for the part-to-part variation, for repeatability and for reproducibility.
Since we have the standard deviation for part-to-part, the first step is to square the standard deviation to calculate the variance: 1.085302 = 1.17788
As the second step, we will sum the variance estimates for the three components: 1.17788 + 0.06278 + 0.01730 = 1.25796
Now that we have an estimate of the total variance, we can estimate the %Contribution for each of the three components by dividing individual components by the total and multiplying by 100:
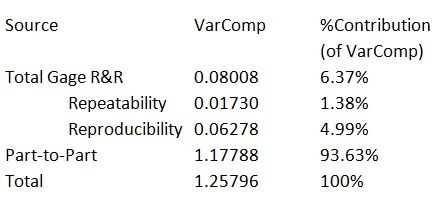
Not bad! Most of our variation is attributable to the part-to-part variation, which is desirable in a good measurement system. What else can we learn?
If we’d like to see a visual representation of how each of the operators measured the same part, we can create an individual scatterplot with groups to represent each of the operators, then add the mean symbol and mean connect line:
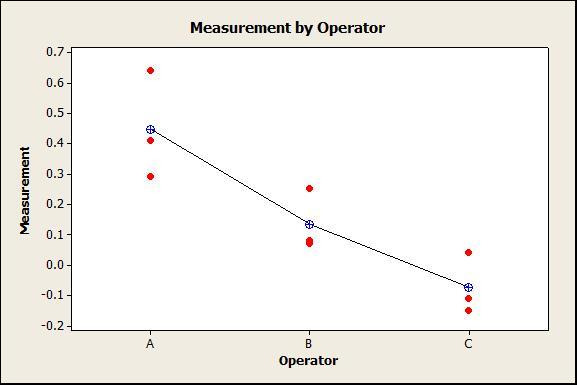
Here we can see that Operator A’s measures are higher than B’s, and B’s are higher than C’s. In the graph above, the vertical points for each operator represent the repeatability, and the measures across operators represent the reproducibility.
Using the same information, we can also obtain estimates of the StudyVar and %StudyVar. First, we’ll need the standard deviation of the variance components, and then we can calculate the Study Variation and % Study Variation as shown below:
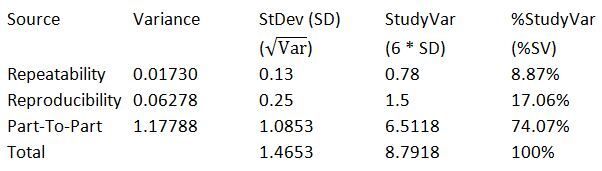
This is really useful information—if we arrange the table as above the result is a close match to what we could obtain from Minitab for a full Gage R&R.
Additionally, we can calculate the number of distinct categories. The number of distinct categories is calculated in Minitab as: (Standard deviation for Parts/Standard deviation for Gage)*1.41
In our example, the StDev for parts is 1.0853 and the StDev for Gage (repeatability + reproducibility) is the square root the two combined variance components which is 0.282984, so we get: (1.0853/0.282984)*1.41 = 5.4
In Minitab, the result of the distinct number of categories is truncated so if we’d analyzed our Gage R&R in Minitab for multiple parts, the number of distinct categories would be 5 for this example.
So, if we have an estimate of the historical standard deviation for the Part-to-Part variation we can get a lot of useful information about our measurement system. But what if we don’t have the historical StDev? What if we only have information about the tolerance?
Using the Process Tolerance
If we do not have a historical estimate of the part-to-part variation, we can still obtain some useful information using the process tolerance. We can calculate the %Tolerance for the total gage by dividing the StudyVar for each source by the tolerance. For our example, let’s say the tolerance is 8:
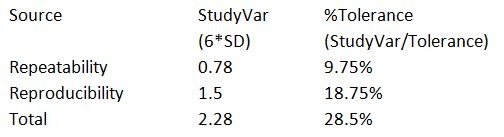
Of course, the results of the StudyVar/Tolerance were multiplied by 100 to obtain the percentages.