


Suppose you’ve collected data on cycle time, revenue, the dimension of a manufactured part, or some other metric that’s important to you, and you want to see what other variables may be related to it. Now what?
When I graduated from college with my first statistics degree, my diploma was bona fide proof that I'd endured hours and hours of classroom lectures on various statistical topics, including linear regression, ANOVA, and logistic regression.
However, there wasn’t a single class that put it all together and explained which tool to use when. I have all of this data for my Y and X's and I want to describe the relationship between them, but what do I do now?
Back then, I wish someone had clearly laid out which regression or ANOVA analysis was most suited for this type of data or that. Let's start with how to choose the right tool for a continuous Y…
Continuous Y, Continuous X(s)
Example:
Y: Weights of adult males
X’s: Age, Height, Minutes of exercise per week
What tool should you use? Regression
Where’s that in Minitab? Stat > Regression > Regression > Fit Regression Model
Continuous Y, Categorical X(s)
Example:
Y: Your Mario Kart Wii score
X’s: Wii controller type (racing wheel or standard), whether you stand or sit while playing, character (Mario, Luigi, Yoshi, Bowser, Peach)
What tool should you use? ANOVA
Where’s that in Minitab? Stat > ANOVA > General Linear Model > Fit General Linear Model
Continuous Y, Continuous AND Categorical X(s)
Example:
Y: Number of hours people sleep per night
X’s: Age, activity prior to sleeping (none, read a book, watch TV, surf the internet), whether or not the person has young children…“I had a bad dream, I'm thirsty, there’s a monster under my bed!”
What tool should you use? You have a choice of using either ANOVA or Regression
Where’s that in Minitab? Stat > ANOVA > General Linear Model > Fit General Linear Model or Stat > Regression > Regression > Fit Regression Model
I personally prefer GLM because it offers multiple comparisons, which are useful if you have a significant categorical X with more than 2 levels. For example, suppose activity prior to sleep is significant. Comparisons will tell you which of the 4 levels—none, read a book, watch TV, surf the Internet—are significantly different from one another.
Do people who watch TV sleep, on average, the same as people who surf the Internet, but significantly less than people who do nothing or read? Or, perhaps, are internet surfers significantly different from the other three categories? Comparisons help you detect these differences.
Categorical Y
If Y is categorical, then you can use logistic regression for your continuous and/or categorical X’s. The 3 types of logistic regression are:
Binary: Y with 2 levels (yes/no, pass/fail)
Ordinal: Y with more than 2 levels that have a natural order (low/medium/high)
Nominal: Y with more than 2 levels that have no order (sedan/SUV/minivan/truck)
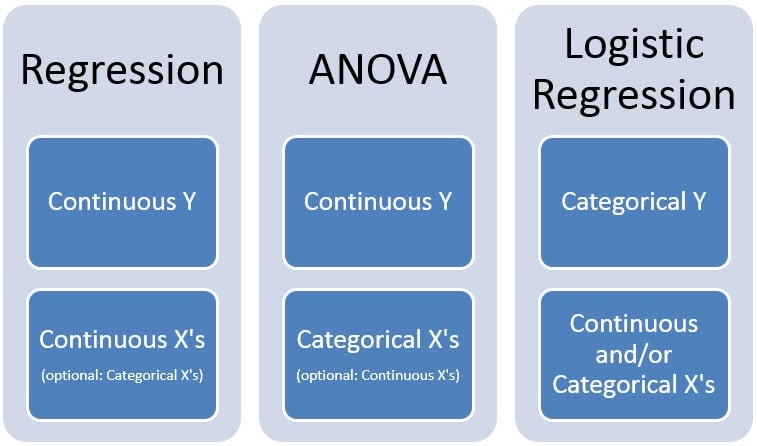
So the next time you have a bunch of X’s and a Y and you want to see if there's a relationship between them, here is a summary of which tool to use when:
For step-by-step instructions on how to use General Regression, General Linear Model, or Logistic Regression in Minitab Statistical Software, just navigate to any of these tools in Minitab and click Help in the bottom left corner of the dialog. You will then see ‘example’ located at the top of the Help screen. And Minitab customers can always contact Minitab Technical Support at 814-231-2682 or www.minitab.com/contact-us. Our Tech Support team is staffed with statisticians, and best of all, accessing them is free!