


In my last post, I talked about the danger of excluding interactions between factors in ANOVA and DOE models. Let’s now look at what can happen if you exclude an important factor altogether.
Warning: misleading high p-value up ahead...
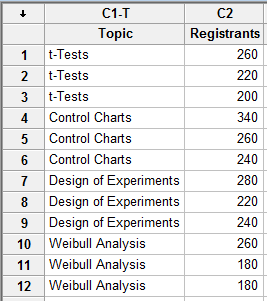
Minitab regularly hosts webinars on different statistical topics. Let’s suppose we want to evaluate if certain webinar topics are more popular than others, so we collect data on the number of people who register for various sessions, including t-tests, control charts, design of experiments and Weibull analysis. Here’s an example of what the data might look like:
To test if the average number of registrants for all 4 webinar topics is equal, we can use analysis of variance (ANOVA). Here are the results using Minitab Statistical Software:
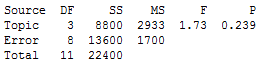
We see that the p-value is 0.239. Using an alpha level of 0.05, we would fail to reject the null hypothesis that all 4 means are equal. Practically speaking, we could conclude that all four webinar topics appear to be equally popular -- or rather, that there is not sufficient evidence to conclude otherwise.
DANGER: This conclusion is wrong!
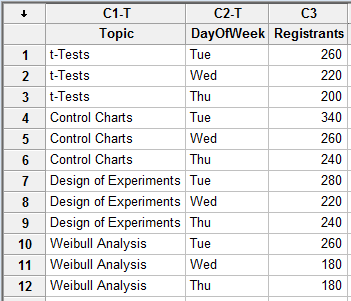
Our conclusion is wrong? How can this be, you ask? Well, I neglected to mention that the webinars were hosted on different days of the week. What if that affects registration? Let's see what happens if we include a DayOfWeek column in our data:
Now we can rerun the ANOVA to include 'DayOfWeek':
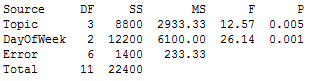
Notice that the Topic p-value has changed from 0.239 to a (significant) p-value of 0.005! And our conclusion has changed as well. Not only is there now a significant difference between at least 2 of the topics, but the day on which the webinar is hosted also is significant, with a p-value of 0.001.
What’s Going On with These P-values?
If statistics is your thing, here's where it gets a little exciting…with ANOVA, we analyze the variation to determine if there’s a difference between the means. The basic logic behind ANOVA is that within-group variation (i.e., within-webinar-topic variation) is due only to random error. If the variability between groups (i.e., from topic to topic) is similar to that within groups, then the means are likely to differ only because of random error. Thus, the p-value will not be significant.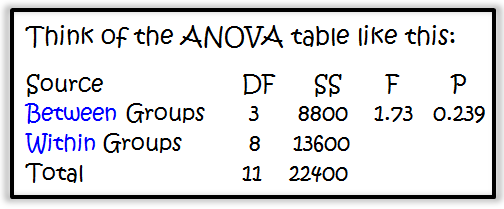
If you want to consider the formulas, the between-group variation is divided by the within-group variation – the random error – to arrive at our F statistic. The larger the F statistic (for given degrees of freedom values), the smaller the p-value.
In the first analysis above, our within-group variation was NOT only due to random error. It erroneously included the day-of-the-week variation as well. Because the within-group variation was falsely inflated, it masked the significant Topic effect. However, when we included DayOfWeek in the model, providing for a better (smaller) estimate of the error, we saw that both Topic and DayOfWeek were significant.
So the moral of the story is that if you exclude important factors from your analysis, there may be danger lurking up ahead and even the significance of the important factors that you do include may go unrecognized.