


Statistical inference uses data from a sample of individuals to reach conclusions about the whole population. It’s a very powerful tool. But as the saying goes, “With great power comes great responsibility!” When attempting to make inferences from sample data, you must check your assumptions. Violating any of these assumptions can result in false positives or false negatives, thus invalidating your results. In other words, you run the risk that your results are wrong, that your conclusions are wrong, and hence that the solutions you implement won’t solve the problem (unless you’re really lucky!).
You’ve heard the joke about what happens when you assume? For this post, let’s instead ask “What happens when you fail to check your assumptions?” After all, we’re human—and humans assume things all the time. Suppose, for example, I want to schedule a phone meeting with you and I’m in the U.S. Eastern time zone. It’s easy for me to assume that everyone is in same time zone, but you’re really in California, or Australia. What would happen if I called a meeting at 2:00 p.m. but didn’t specify the time zone? Unless you checked, you might be early or late to the meeting, or miss it entirely!
The good news is that when it comes to the assumptions in statistical analysis, Minitab has your back. Minitab has even more features to help you verify and validate the needed statistical analysis assumptions before you finalize your conclusion. When you use the Assistant in Minitab, the software will identify the appropriate assumptions for your analysis, provide guidance to help you develop robust data collection plans, check the assumptions when you analyze your data, and let you know the results in an easy-to-understand Report Card and Diagnostic Report.
The common data assumptions are: random samples, independence, normality, equal variance, stability, and that your measurement system is accurate and precise. In this post, we’ll address random samples and statistical independence.
What Is the Assumption of Random Samples?
A sample is random when each data point in your population has an equal chance of being included in the sample; therefore selection of any individual happens by chance, rather than by choice. This reduces the chance that differences in materials or conditions strongly bias results. Random samples are more likely to be representative of the population; therefore you can be more confident with your statistical inferences with a random sample.
There is no test that assures random sampling has occurred. Following good sampling techniques will help to ensure your samples are random. Here are some common approaches to making sure a sample is randomly created:
- Using a random number table or feature in Minitab (Figure 1).
- Systematic selection (every nth unit or at specific times during the day).
- Sequential selection (taken in sequence for destructive testing, etc.).
- Avoiding the use of judgement or convenience to select samples.
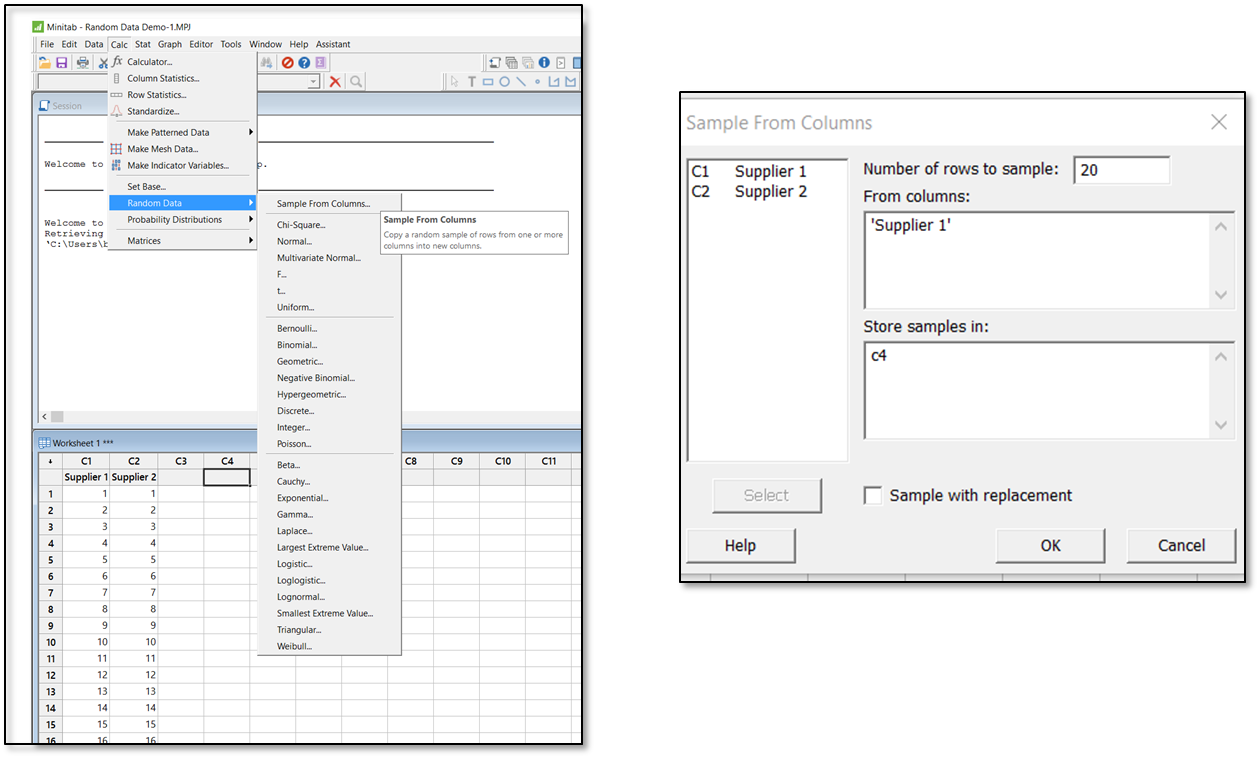
Figure 1. Random Data Generator in Minitab
Non-random samples introduce bias and can result in incorrect interpretations.
What Is the Assumption of Statistical Independence?
Statistical independence is a critical assumption for many statistical tests, such as the 2-sample t test and ANOVA. Independence means the value of one observation does not influence or affect the value of other observations. Independent data items are not connected with one another in any way (unless you account for it in your model). This includes the observations in both the “between” and “within” groups in your sample. Non-independent observations introduce bias and can make your statistical test give too many false positives.
Following good sampling techniques will help to ensure your samples are independent. Common sources of non-independence include:
- Observations that are close together in time.
- Observations that are close together in space or nested.
- Observations that are somehow related.
Minitab can test for independence using the Chi-Square Test for Association, which is designed to determine if the distribution of observations for one variable is similar for all categories of the second variable.
The Real Reason You Need to Check the Assumptions
You will be putting a lot of time and effort into collecting and analyzing data. After all the work you put into the analysis, you want to be able to reach correct conclusions. You want to be confident that you can tell whether observed differences between data samples are simply due to chance, or if the populations are indeed different!
It’s easy to put the cart before the horse and just plunge in to the data collection and analysis, but it’s much wiser to take the time to understand which data assumptions apply to the statistical tests you will be using, and plan accordingly.
In my next blog post, I will review the Normality and Equal Variance assumptions.