


MInitab Engage® is our software for executing and reporting on quality improvement projects. It consists of a desktop app, which practitioners use to do project work, and a web app, which includes a customizable dashboard that offers stakeholders up-to-the-minute graphical summaries and reports. Since the desktop app automatically updates the dashboard as teams do their work, teams are freed to complete critical tasks instead of creating reports or entering data in a separate system.
In this blog, I will explore the web app, following up on earlier posts that provided an overview of the Engage platform, and detailed features in the desktop app.
Minitab Engage's Web Application
Engage helps teams complete their projects faster and more consistently, while giving you and your stakeholders insight to make critical business decisions.
The focal point of Engage’s web app is a dashboard that gives you visibility into your entire program. The dashboard makes it easy to assess the progress of all projects, or just a subset. You can monitor the KPIs you need to make important business decisions or search for, open, and explore projects to see detailed activities at the individual project level. Dynamic reports can give everyone in your company access to the information you want to share, but you also can restrict access to sensitive projects and data to the appropriate people.
The Engage web app works in concert with the desktop app to maximize the benefits of your improvement initiative and provide unparalleled insight into its impact on KPIs and the bottom line.
The web app consists of three components: the project repository, the dashboard, and the design center.
The Project Repository
Engage’s project repository is a secure, centralized storage system that houses all of your organization’s individual improvement projects and can be accessed from anywhere. The repository makes it easy for project owners and administrators to grant or revoke access rights to projects, and to include and exclude projects from dashboard reports.
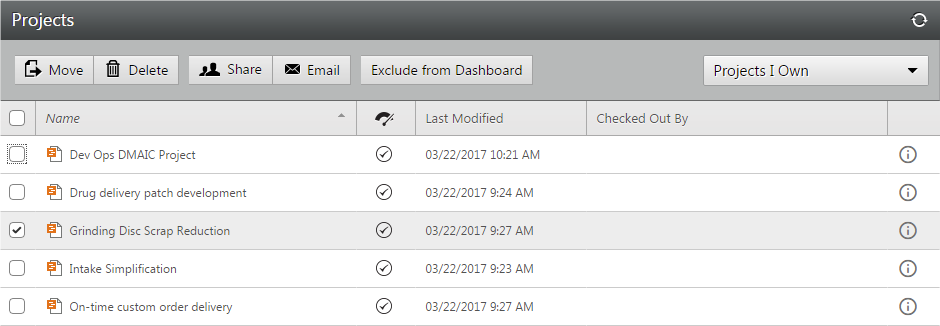
Engage's Project Repository
In addition, you can use filters to easily display all projects, projects you own, or projects that have been shared with you, making it easy for you to find projects you are a part of.
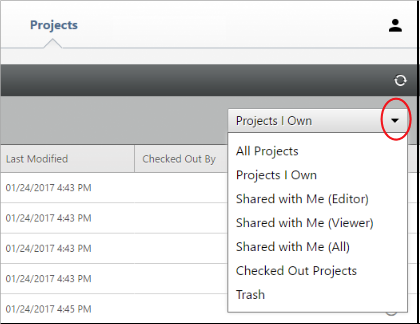
Project Filters
The Dashboard
Engage’s dashboard draws on the data from projects stored in the repository to provide a dynamic graphical summary of your program. It can show you financial summaries, status reports, project impacts, progress toward set targets, and more. View your entire initiative, or select and focus on specific projects, teams, or divisions. You can access the dashboard wherever and whenever you need to, from any Internet-connected computer, tablet or device.
The components and features of the dashboard are shown and detailed below:
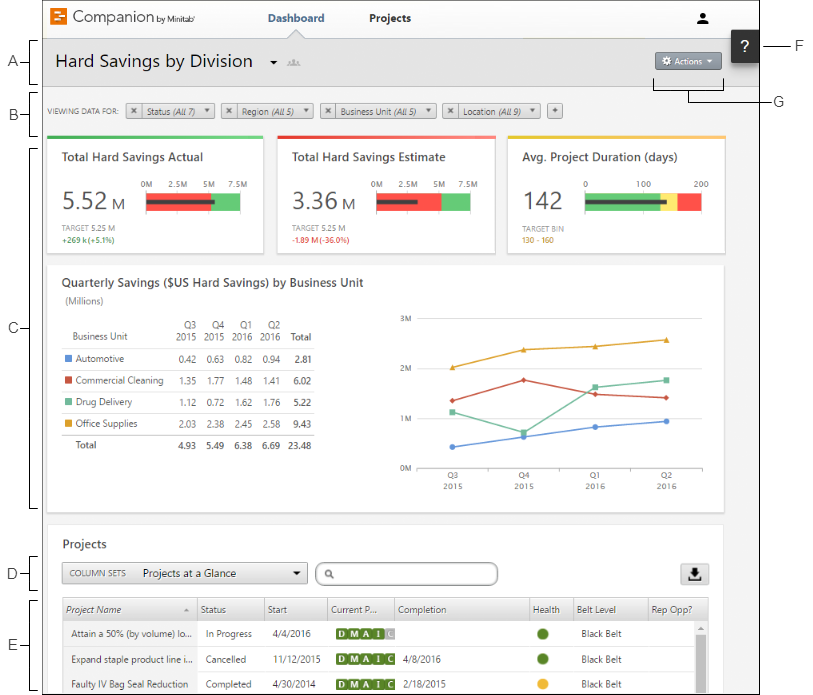
A. Report: A collection of filters, summaries, and column sets.
B. Filters: Allows you to focus on a subset of projects, based on a condition, such as region, location, or project status.
C. Summaries: Displays aggregate project data, such as the number of projects in each division, the average duration of projects, or the total project savings by quarter. Also displays optional targets.
D. Column Set: Determines the fields that are displayed for each project in the project list.
E. Project List: Displays a list of all projects meeting the current filter’s criteria.
F: Help: Gives you access to topics, videos, the Quick Tour, and the download link for the desktop app.
G: Action Menu: Gives you access to common tasks, such as editing, copying, and creating new reports, saving a report as a PDF, and setting default reports.
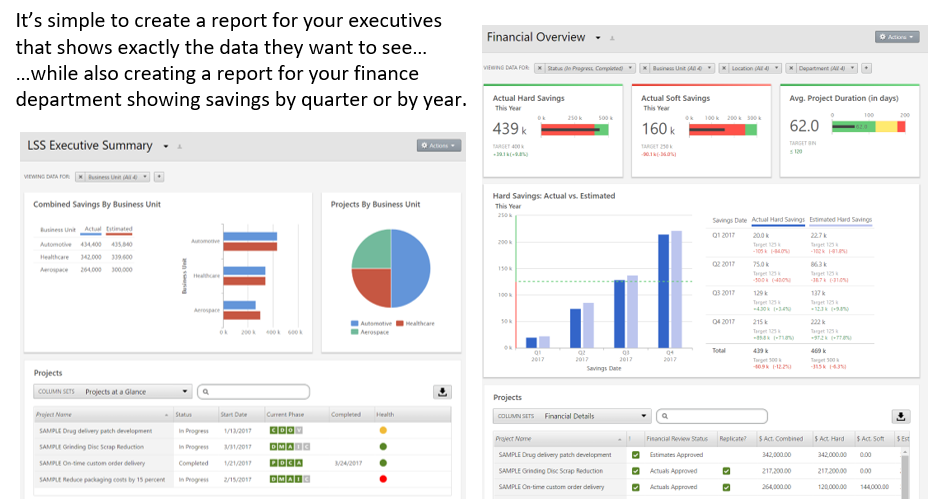
Tailor-made Reports
You can create an unlimited number of dashboard reports on different aspects of your initiative. Create reports that include only projects from specific facilities, as well as reports that summarize information from across the organization. Any report can deliver as much or as little detail as needed.
Reports can be public and visible to everyone in your subscription, or they can be private and visible only to you. Icons to the right of the dashboard title indicate if the report is private or public, as shown.
The Design Center
When you deploy Engage, your data architects customize your subscription to reflect your improvement methodology. But as organizations and processes evolve, so will your needs. Engage’s design center makes it easy to edit and create templates, forms, tools, and data fields.
The design center automatically tracks the changes you make, so you know what was changed and when. The data architects work in the sandbox (Figure 7.), a safe and risk-free environment to make changes to the web features. Best of all, even while your data architect is updating project templates, data definitions, and forms, there is zero downtime for your users.
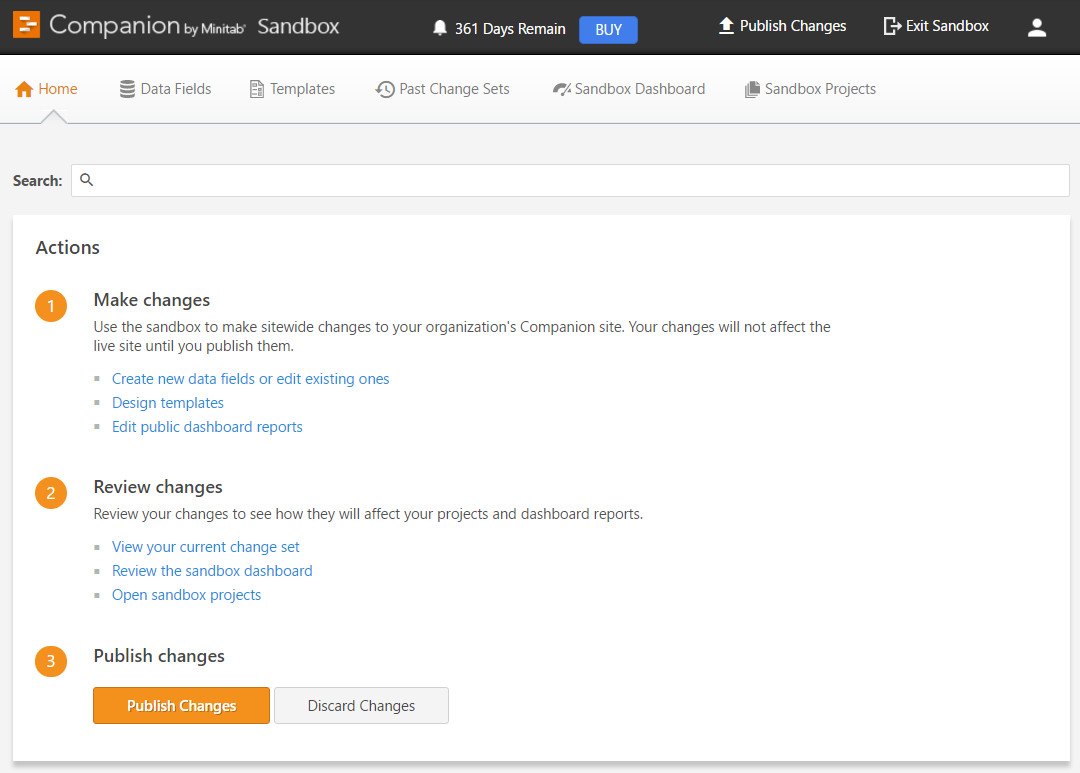
Engage's Sandbox
The cloud-based web app is hosted by Microsoft Azure with automatic daily, weekly and monthly backups to safeguard your data using the latest methods. Microsoft Azure data centers guarantee a 99.95% uptime and meet a wide range of internationally recognized security and compliance standards.
Engage deploys quickly—your entire organization can be up and running in a matter of days. Easy-to-customize roadmaps and templates ensure teams follow your company’s methods and provide the information you need. Engage is the best solution for managing, understanding, and sharing the impact of your continuous improvement program.
Why wouldn’t you want to give your people the best tools to make difficult problem solving and reporting easier?