


Via Christi Health, the largest provider of healthcare in Kansas, operates a Center for Clinical Excellence that's made up of a team of quality practitioners, all who have Lean and Six Sigma training. I recently had the opportunity to talk with the team about the types of projects they're working on.
I learned not only about the areas of patient care where they are targeting improvements, but about one particular project the team completed to determine if process changes put into place in the hospital's emergency department actually improved the patient experience.
I thought it was an interesting case study to share not only with practitioners working in healthcare, but with any quality professional who is looking to prove statistically that process changes are actually making a difference.
Like many healthcare providers, at Via Christi, they sought to make their services as efficient and consistent as possible now that more and more patients are needing to be served by the healthcare system.
The various emergency departments (ED) made several changes, such as adjusting the various reporting processes for tracking patients through the different areas of the ED, making leadership changes, reallocating hospitality staff, and reducing the total number of beds in the ED’s intensive care unit. But they really wanted to see if these changes actually improved the patient experience in the ED and helped the department get closer to its goals for efficiency and consistency.
Analyzing the Data with Minitab
The team had access to the raw patient throughput data from several months before the process changes were made, as well as from the first few months after the changes were made. They analyzed the data using various charts in Minitab, including Individuals and Moving Range (I-MR) charts, histograms, boxplots, and interaction plots, as well as calculating the descriptive statistics on the raw throughput time data—including mean and standard deviation to make before-and-after comparisons, and performing an analysis of the before and after mean times.
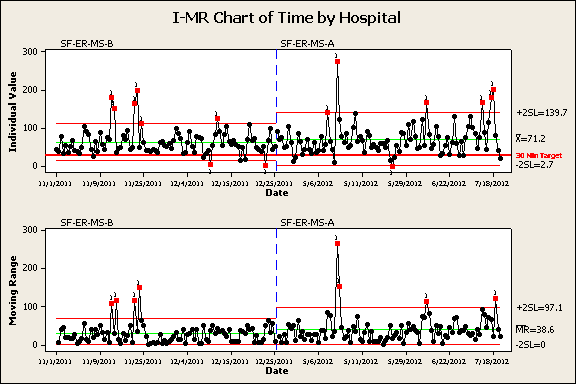
The team used the I-MR chart above to compare the before and after throughput times and the process variation by area. This particular chart showed a slight average increase of around 8 minutes and greater variation after the changes were made to the process.
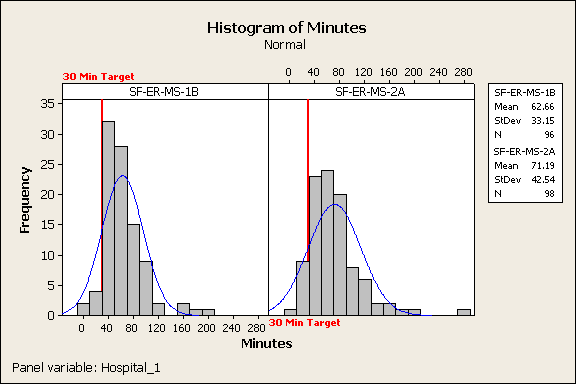
To compare the shape and spread of the time data before and after changes were made, the team built histograms in Minitab. The histograms above showed that the majority of patient throughput times (both before and after changes) surpassed the mean target time of 30 minutes. In addition, the histograms showed that the mean increased after the changes were made, again by around 8 minutes for this particular ED area. Histograms were also used to see if a certain day of the week or shift resulted in more variation.
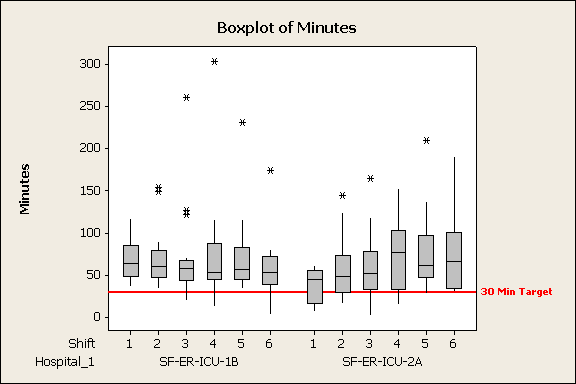
The team also used boxplots to assess and compare the mean throughput times by shift before and after process changes were made. For the particular change charted above, the mean throughput times decreased slightly across all ED shifts.
Other 'Revelations'
What else did the data analysis reveal? After changes were made in the ED, there was only a slight improvement to the mean patient throughput time in two of the four ED areas where process changes were explored. In the two other areas where process changes were made, there was actually an increase in the mean throughput time.
“Although two areas showed slight improvement and two areas showed decline, statistically there was no significant difference between the before and after results by ED area,” says Rob Dreiling, process improvement specialist at Via Christi Health, who assisted with this project. “Our gut was telling us that the process changes had made such great improvements in the mean patient throughput times, but the data said otherwise.”
The graphs and charts helped the process improvement specialists to show the emergency department team what the data was really saying about the changes that were made. “We were then able to help them look at improvement projects in a different way," Dreiling says. "Instead of jumping in and just trying a change to the process, we taught the team to map the process from beginning to end and then use statistics to start focusing on the right areas, so the projects will make a meaningful difference and we’re getting the most bang for our buck.”
Have you ever been surprised by what the statistics had to say about your process improvement efforts? Tell us in the comments, or share your story with us in a guest post on the Minitab Blog: http://blog.minitab.com/blog/landing-pages/share-your-story-about-minitab/n
And to learn more about Via Christi Health's project, check out the full case study - Lean and Six Sigma Efforts at Via Christi Health: Bringing Safe, High-Quality Care