


After you’ve done the work to analyze your data in statistical software such as Minitab, it’s likely that you’ll want to organize your output and results into a presentation for colleagues or clients.
You want your presentation to look great, so check out these tips below for ensuring your graphs look as good in your presentations as they look in the software:
1. Sizing Minitab Graphs for Presentations
Minitab graphs can be too large when you import them into a Word file or PowerPoint presentation. While you can click and drag a graph image to make it fit the layout, this method can distort the image. Here’s how to size the graph without distortion:
- Set the appropriate size in Minitab before you copy the graph. Minitab automatically redraws the elements of the graph (such as the title, symbols, etc.), so that they don’t become distorted. Just double-click the graph region (in Minitab) and click the Graph Size tab to change the dimensions:

- When you create a report in PowerPoint, use its Best scale for slide show option to optimize the size of a graph at a given screen resolution. Right-click the item (within PowerPoint) and choose Size and Position, and then check Best scale for slide show.
2. Maintaining Image Clarity
In Minitab, the default graph displays are always clear. But, when you shrink and resize graphs to fit them into your report, they may not look as crisp. Here are two solutions to maintain clarity:
- Resize critical elements in Minitab before copying. Enlarging the font size of detailed tables and labels can keep them legible in situations where a graph must be dramatically reduced in size.
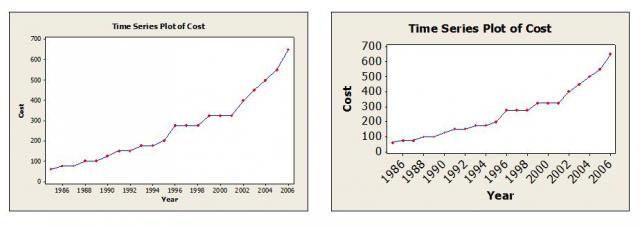 The text in the original graph (left) was enlarged beyond its default size (right) within Minitab before copying over to Word or PowerPoint.
- Use a file format that maximizes clarity. Though resizing by clicking and dragging within your report isn’t recommended, you can minimize its negative effects with one of the following file formats when you paste your graph using Edit > Paste Special: the Enhanced Metafile to maintain the clearest graph text or the Bitmap format to retain the crispness of graph points and symbols.