


In my last post, we talked about using statistical tools to identify the right distribution of our lightsaber manufacturing data. Now that we have our data in Minitab along with a specific distribution picked out, we can find out if we are dealing with an in-control process. If the process is not in control, the capability estimates will be incorrect. Thus, an extremely important (and often overlooked) aspect of Capability Analysis is to make sure our process in first in control. We can do this with a tool Minitab Statistical Software offers called the Capability Sixpack.TM
First, let’s go to Stat > Quality Tools > Capability Sixpack > Normal. We’ve gotten our spec limits from the Jedi Temple, and know that they require the lightsabers to be between 2.75 to 3.25 feet in length. We also know that we have a target length of 3 feet. Knowing this information, we can fill out the dialog as follows:
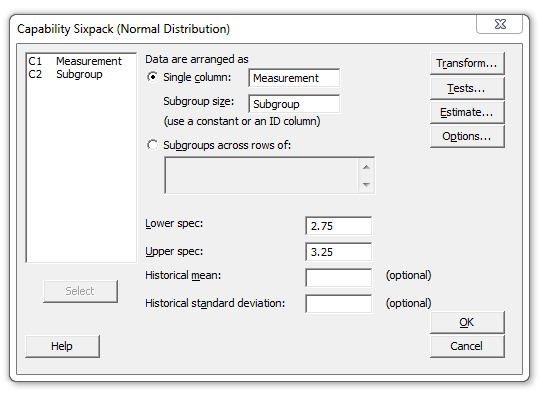
We also want to tell Minitab that our measurements have a target we are trying to hit. Click the ‘Options’ button and enter a target of 3. Click OK in each menu, and our Capability Sixpack will be displayed.
Let’s see whether our process is in-control. Let’s first take a look at the Xbar Chart. We want to see the points randomly distributed between the control limits. This implies a stable process. The R chart works the same way. Again, we are looking to see the points randomly distributed between the control limits.
Looking at both of our charts in the Capability Sixpack, they seem to fit the conditions of a stable process. This is what we’re looking for. If our process isn’t stable, our capability analysis results can’t be trusted.
We should also compare points on the R chart with those on the Xbar chart to see if the points follow each other. If the process is stable, they shouldn't. These points do not follow each other, which again implies a stable process.
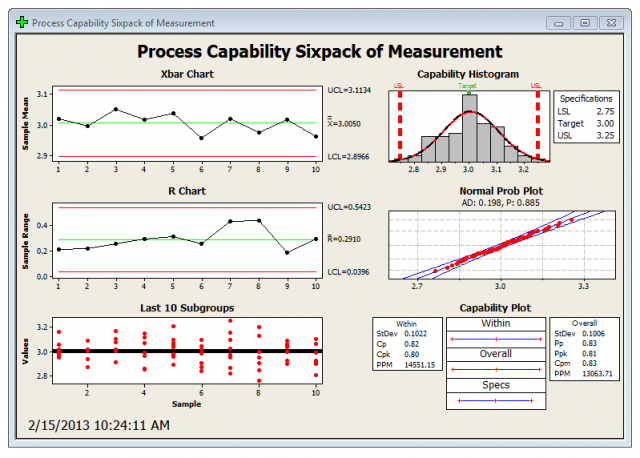
We also want to look at the Last 10 Subgroups Graph. Here, we're looking for a random, horizontal scatter, with no apparent shifts or drifts in the data. Shifting and drifting indicates a process that is out of control. Looking at our graph, the scatter appears to be randomly spread out, with no trends sticking out anywhere. All of our graphs seem to indicate that we have an in-control, stable graph. This is exactly what we are looking for.
If you want the interpretation of the process capability statistics to be valid, your data should approximately follow a normal distribution, as I discussed in my last blog post. On the capability histogram, the data approximately follow a normal curve. In addition, the points on the normal probability plot approximately follow a straight line and fall within the 95% confidence interval. These patterns indicate that the data are normally distributed, and confirm what we found in the last post, which was that our data are indeed normal.
Taking into account that our data appear to be normal, and follow an in control, stable process, we are clear to go ahead and conduct a Capability Analysis whose results we can fully trust.
Next post, we'll perform the analysis and look in detail about what our capability analysis results tell us about lightsaber production, and whether we are meeting the standards that have been set for us by the Jedi Temple.