


In my previous post, you learned how to prepare your data for capability analysis in Minitab. Now let's see where we need to go in the statistical software to run the correct Capability Analysis.
When it comes to capability analysis, Minitab offers a few different choices. We offer Normal Capability Analysis for when your data follow a normal distribution. If your data follow a different distribution, such as the Weibull distribution, there's Non-normal Capability Analysis. We also offer Binomial Capability and Poisson Capability for when you are looking to produce a process capability report and your data are from one of those distributions.
Continuing our lightsaber manufacturing example, you know you have continuous data. But what distribution is it from? Is it normal? How do you know?
Distribution Identification for Capability Analysis
Thankfully, Minitab has a tool specifically designed for a situation like this. This can be found by going to Stat > Quality Tools > Individual Distribution Identification.
You can use this menu to evaluate which distribution best fits the data you collected. By looking at the probability plots and the goodness-of-fit tests, you can see which distribution the data follow.
In the Individual Distribution Identification menu, enter the measurement column along with the subgroup size column, which we set up earlier.
Now you can have Minitab test your data against all 14 available distributions, along with the Box-Cox and Johnson transformations. Alternatively, you can specify a few select distributions to test against. If you have some knowledge about your process and what distributions the data may follow, you may only be interested in comparing your data against a few distributions that you know are likely to fit. Minitab allows you to do this.
In our case, we have no idea what distribution we may be dealing with. The Jedi temple is fairly new to statistical analysis, so we are blazing our own trail, so to speak. Therefore, we should check against all distributions and transformations so we cover all our bases. When you click OK, you get several pieces of valuable information in the Minitab output.
First, you will get a table with the descriptive statistics of the data:
Then, you get the results from the Goodness of Fit tests:
You will also receive distribution ID plots, like these:
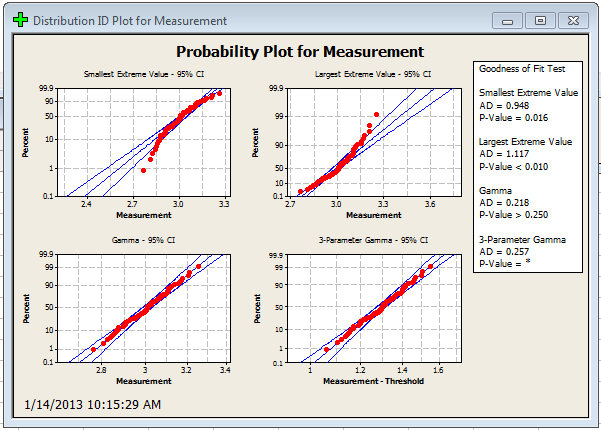
What Distribution Does My Data Follow?
With all this information, how do you actually go about picking a distribution? First, we can take a look at our probability plots. I’ve highlighted 2 examples below. The first represents the normal distribution, and the second represents the Weibull distribution.
If you look at the Normal distribution probability plot, all of the data points fall within the blue 95% confidence bands. This is good, and shows the distribution is a good fit.
In the case of the Weibull graph, there seems to be some skewness in the data. If you look at the tails of the dataset, you'll notice they seem to fall away from the straight line. This is indicative of a bad distribution fit.
Looking Beyond the Probability Plots
Now, eyeballing the graphs is a quick and dirty way to see which distribution may fit, but we also need to look at the numbers. If it seems like a few distributions could fit, the way to go would be to choose the distribution with the largest p-value.
The good news is that no matter which distribution you find to fit, you can perform Capability Analysis on it in Minitab. In our case, the normal distribution yields the highest p-value, so we are going to work with that.
Based on these findings, we can go ahead and use the normal capability analysis procedures. However, now that you know what distribution you’re using, first you want to verify that your process is in statistical control.