


Technology is very much part of our lives nowadays. We use our smartphones to have video calls with our friends and family, and watch our favourite TV shows on tablets. Technology has also transformed the fitness industry with the increasing popularity of fitness trackers.
Recently, I got myself a fitness watch and it's becoming my favourite gadget. It can track how many steps I’ve taken, my heart rate during a workout, and how many calories I've burned during my workout and over the whole day. Based on the calories burned, I can adjust my diet to ensure I have eaten what I require for the day. I’ve been collecting data from my weekly Zumba sessions, gym workouts and lunch-time walks. After collecting data for over a month, I decided to do some analysis with it using Minitab. Below is a snapshot of the data I collected in Minitab.
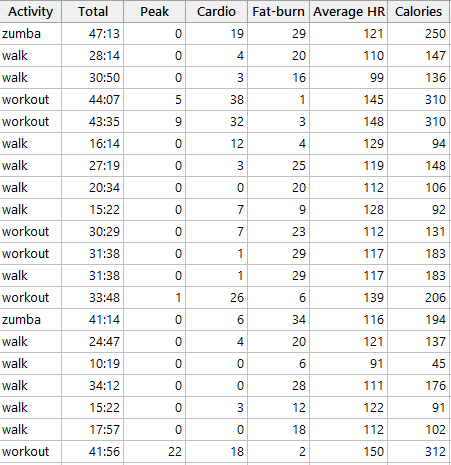
For each activity, I have the following information:
- Duration of exercise in minutes and seconds
- Time spent (rounded to nearest minutes) on peak/high-intensity exercise heart-rate zone—heart rate greater than 85% of maximum
- Time spent (rounded to nearest minutes) on cardio/medium-to-high-intensity exercise heart-rate zone—heart rate is 70 to 84% of maximum
- Time spent (rounded to nearest minutes) on fat-burn/low-to-medium-intensity exercise heart-rate zone—heart rate is 50-69% of maximum
- Average heart rate during the session
- Total calories burned during the session
It appears that the higher average heart rate results in more calories burned. Also, this depends on time spent at different heart rate zones. Let’s do some calculation using correlation coefficients.
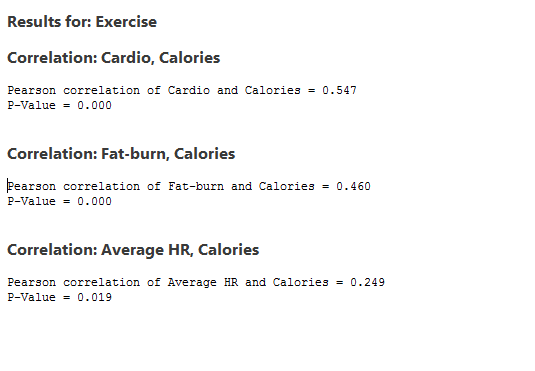
As expected, all three variables are positively correlated with calories burned. However, spending hours on the treadmill is probably not a very good way to burn calories. With the best summer weather just around the corner, I need a more efficient way to exercise to lose the few pounds from my indulgence in the winter months!
According to research, exercising at higher intensity can result in more calories burned due to the “afterburn” effect. The afterburn effect is the additional calories burned after intensive exercise. Recently, at my local gym, they have introduced 30-minute HIIT (high-intensity interval training) sessions, which I am considering taking. Hence, fitting a regression model using my data will probably help me make the decision.
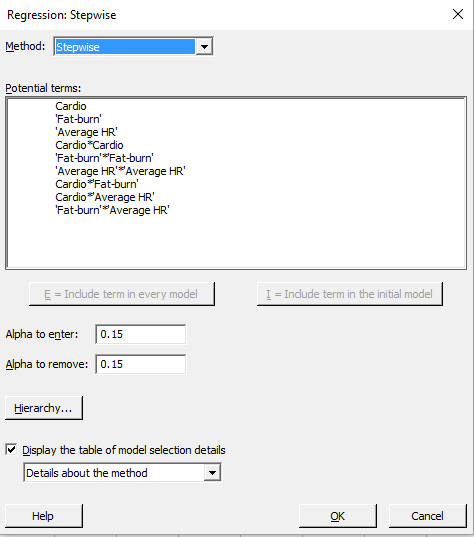
In Minitab, I opened Stat > Regression > Regression > Fit Regression Model, and completed the dialog and sub-dialog boxes as shown below.
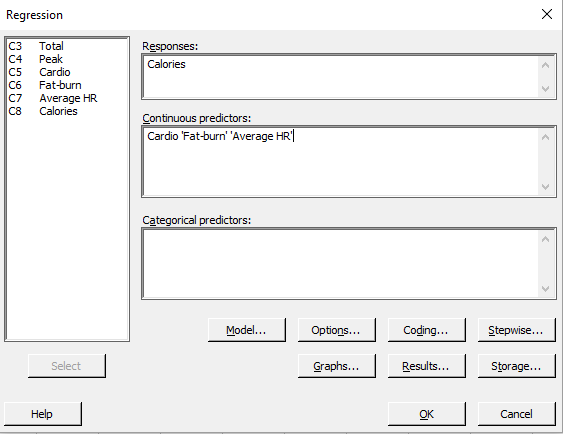
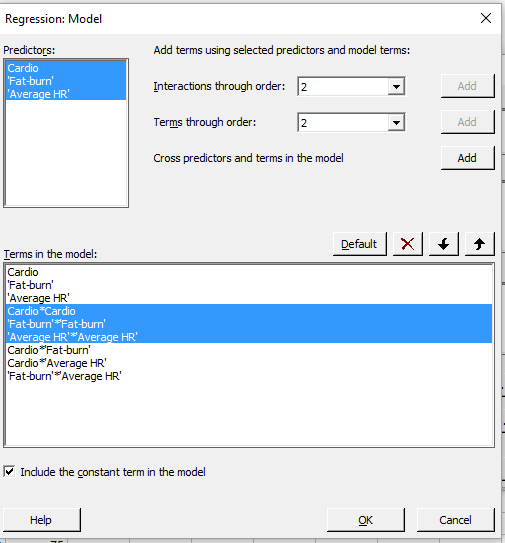
Instead of using a trial-and-error approach to select terms for the model, I will use the stepwise approach to help me identify suitable terms for the model.
And after I press OK on each of my dialogs, Minitab returns the regression equation:
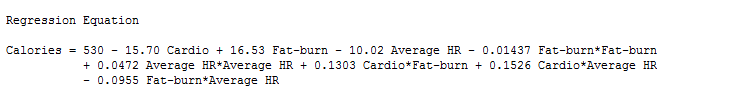
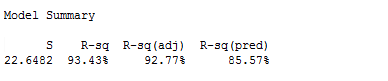
The final model is quite decent, as the three types of R-squared values are all above 80%. This implies I can use this model to make predictions. The regression equation appears complex, but I can use the response optimizer in Minitab 17 to identify optimum settings to achieve my goal.
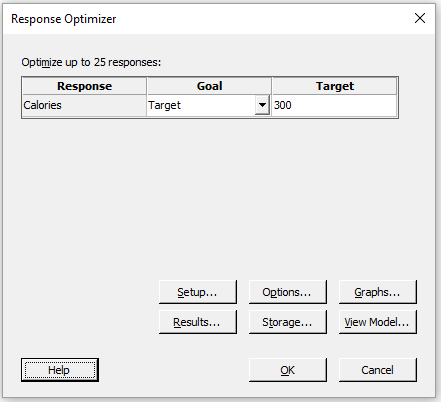
There is a common belief that 1 pound of fat (0.45 kilogram) is approximately equal to 3500 calories. Let’s say I aim to burn about 300 calories in each session. This means after about 12 sessions I would have lost approximately a pound of fat, provided I also had a healthy diet. Since exercising at higher heart rate tends to burn more calories, I will also aim to maintain an average heart rate between, say, 128 and 148, which for me works out as somewhere between 70-80% of maximum heart rate.
With all the conditions above, using Stat > Regression > Regression > Response Optimizer, here are some screenshots of the dialog boxes.
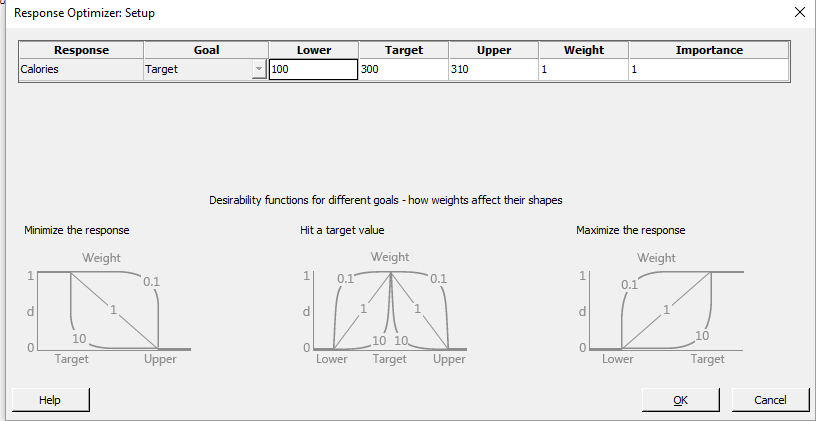
My target calorie burn rate is 300, and getting above 300 would be a bonus. Hence, I am using 310 as the upper limit.
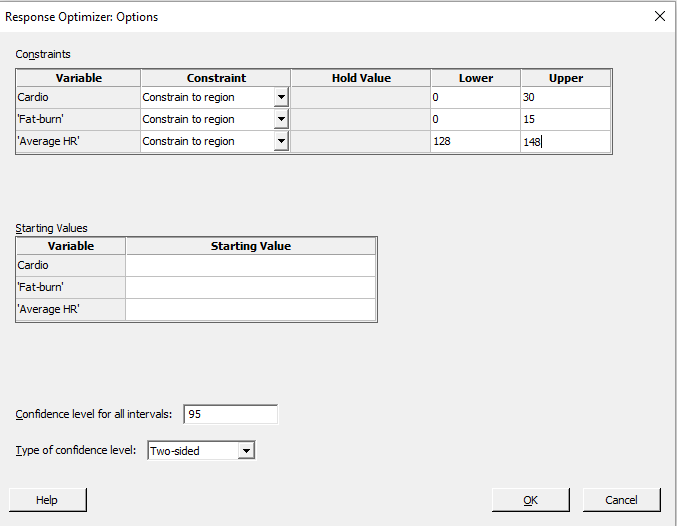
I would like to spend no more than 45 minutes per session and hence I am using a maximum of 30 minutes exercising in the cardio zone, and 15 minutes in the fat-burn zone.
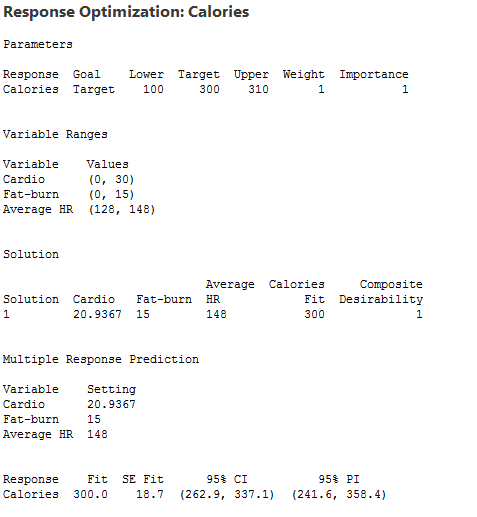
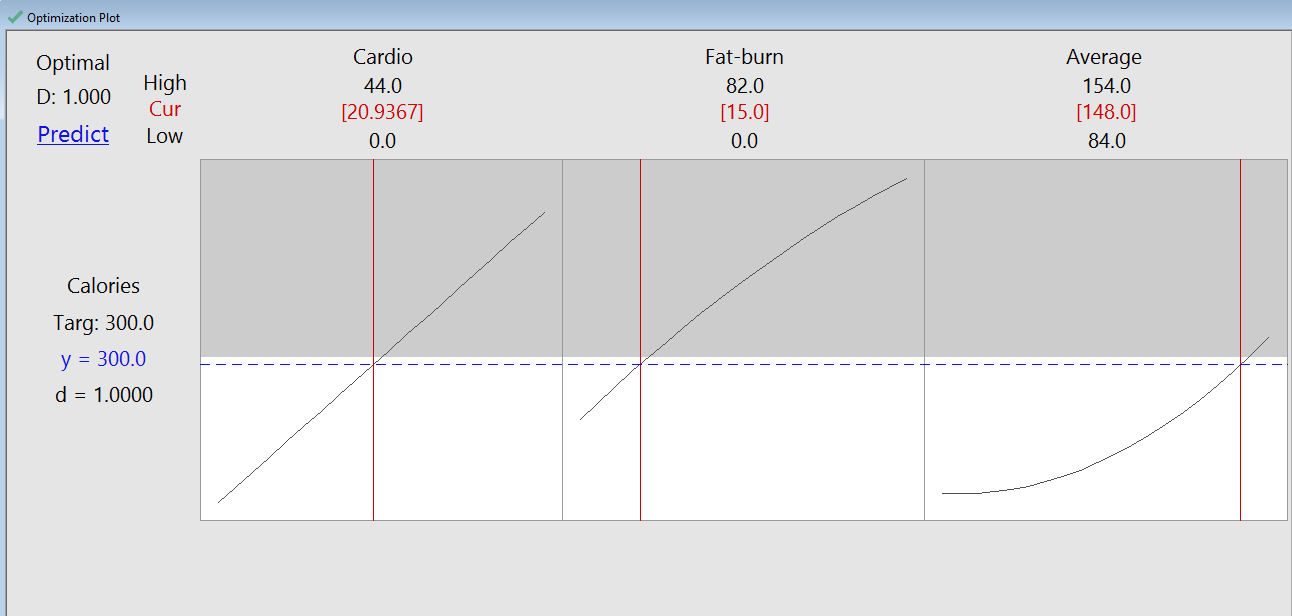
To achieve my goal, I need to exercise in the cardio zone for about 21 minutes, exercise in the fat burn zone for about 15 minutes, and maintain my average heart rate at about 148 for the session.
I understand that the HIIT sessions involve very intense bursts of exercise followed by short, sometimes active, recovery periods. This type of training gets and keeps your heart rate up. Based on this, if out of a 30-minute HIIT session I can maintain about 21 minutes in the cardio zone, and spend the rest of the session exercising in the fat-burn zone, I will be close to achieving my goal. I can always supplement this by a few minutes on the exercise bike or cross-trainer after the class.
Another good feature with the response optimizer is that I can evaluate different settings to see how the changes can affect the response. Let's consider the days when the HIIT class is not offered and I need to use the machines. I normally go for a longer session on the cross trainer (20-30 minutes), followed by a quick 10-minute session on the step machine. From past experience, I can easily get into the cardio heart-rate zone when using the cross-trainer. Now I can use the optimizer to predict the calories burned for 30 minutes of working out in the cardio zone and 10 minutes in the fat-burn zone. I will also use a lower average heart rate of 140.
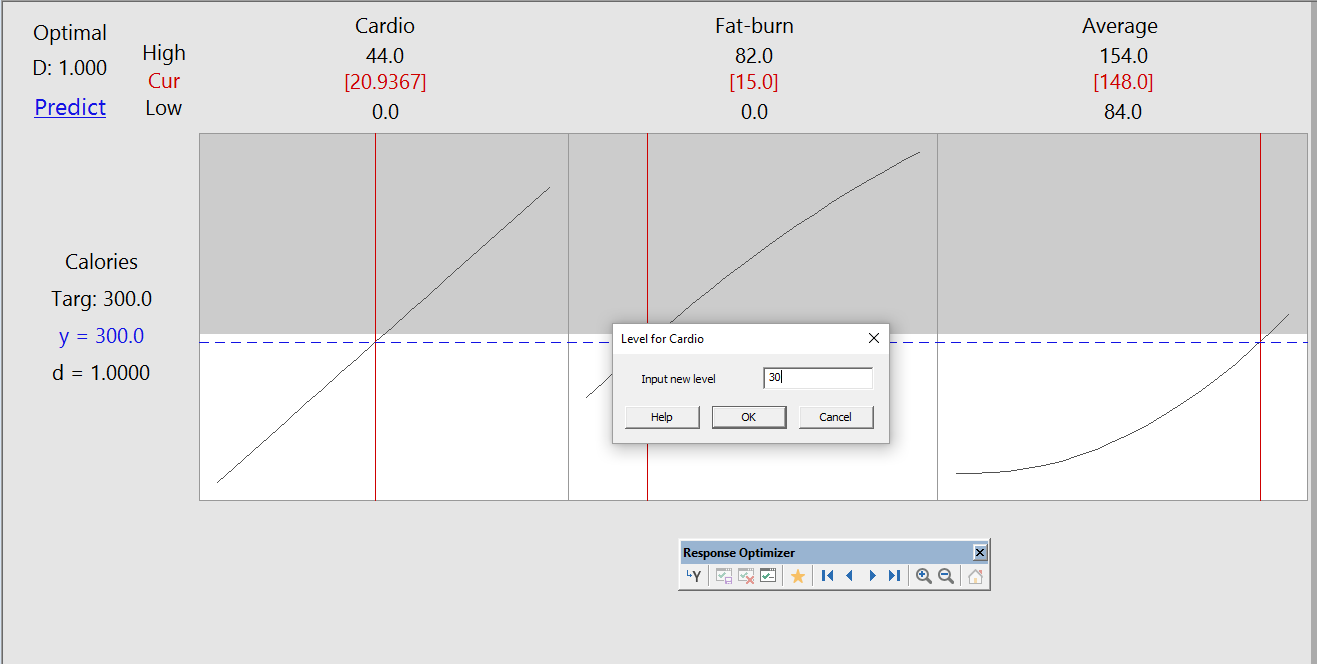
By clicking on the current setup, I can input new settings.
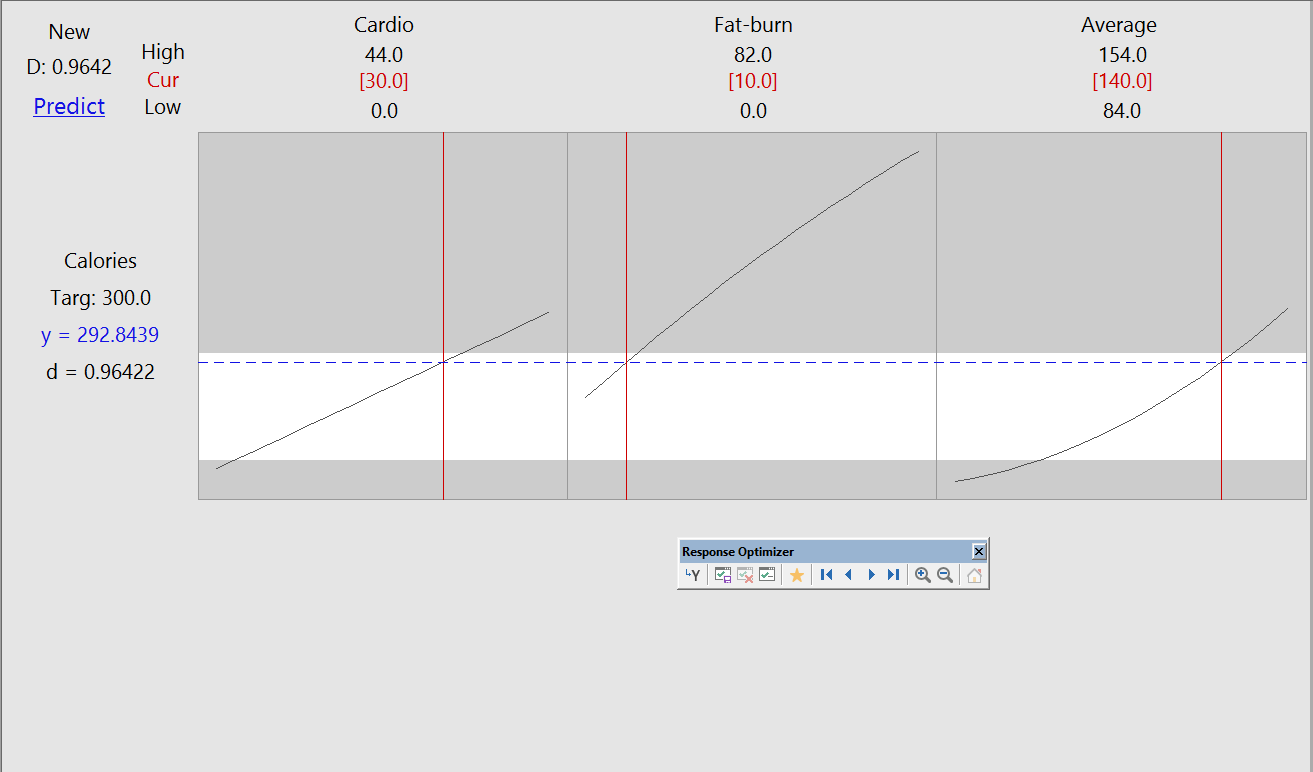
Well, this solution is not too far off from my target of 300 calories burned!
It’s turned out to be an enjoyable and informative experience analysing my own fitness data to see what my best workout options are. Taking the data collected by my fitness tracker and doing further analysis on it has definitely helped me to decide on how to exercise wisely and efficiently.
Gym photo by Indigo Fitness Club Zurich, used under Creative Commons 2.0 license.