


Do you suffer from PAAA (Post-Analysis Assumption Angst)? You’re not alone.
Checking the required assumptions for a statistical analysis is critical. But if you don’t have a Ph.D. in statistics, it can feel more complicated and confusing than the primary analysis itself.
How does the cuckoo egg data, a common sample data set often used to teach analysis of variance, satisfy the following formal assumptions for a classical one-way ANOVA (F-test)?
- Normality
- Homoscedasticity
- Independence
Are My Data (Kinda Sorta) Normal?
To check the normality of each group of data, a common strategy is to display probability plots. In Minitab, choose Graph > Probability Plot > Multiple. Enter the response (‘Length of Cuckoo Egg) as the Graph variable and the grouping variable (Nest) as the categorical variable. Click Multiple Graphs and check In separate panels of the same graph.
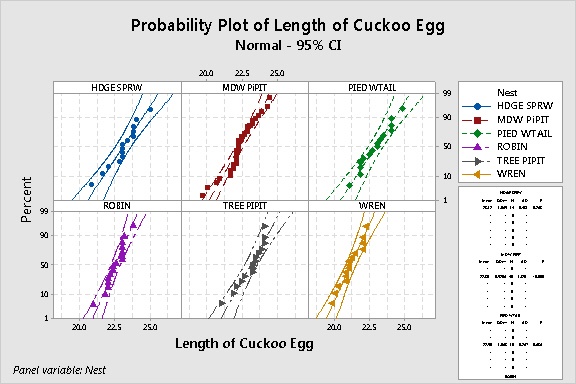
If the data are normally distributed, the points in each plot should fall along a straight line within the curved confidence bands on each side. In the graph above, the points in most plots are “kinda sorta” straight and fall mostly within the confidence bands—except for the meadow pipit group.
The output table at the bottom right of the graph includes the results of a normality test for each group. Not surprisingly, the meadow pipit group “fails” the normality test. (Its p-value is <0.005, so you reject the null hypothesis that the data are normally distributed.)
 Hmmm…now what?
One commonly overlooked factor when interpreting results of a normality test is sample size. Generally speaking, a larger sample size gives the normality test more power to detect departures from normality. When the sample size is small, the test may not have enough “oomph” to catch nonnormality. So you really can’t be sure.
For the cuckoo egg data, sample size for all of the groups is about 15—except for the meadow pipit group, which has 45 data values. It’s probably not a coincidence that the biggest group is the only one flagged as being nonnormal.
Another way to evaluate the normality assumption for ANOVA is to display a normal probability plot of the errors. To do this in Minitab, just click Graphs in the ANOVA main dialog box and check Normal probability plot of residuals.
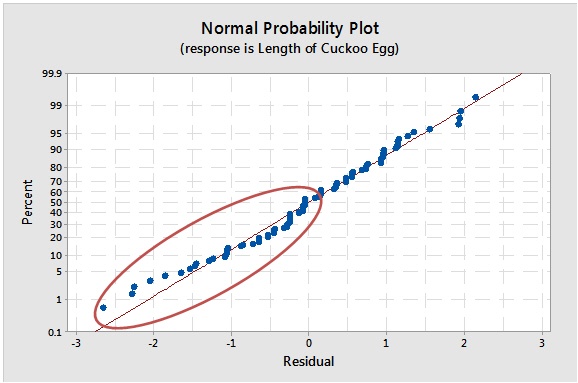
Hmmm. The data kinda sorta fall along the line. But the circled errors on the bottom left indicate some skewness in the left tail. Is it important?
ANOVA is robust to the normality assumption—it can handle “kinda sorta” normal data—if your sample sizes are large enough.
But how large, exactly? It's starting to feel like one fuzzy result leads to another fuzzy result.
You decide to have a bowl of ice cream and move onto the next assumption. Maybe you'll get lucky with...
Homoscedasticity? Say What?
If the term homoscedasticity makes your flesh crawl, read this post. Basically, all it means is that the data in each group should vary by about the same amount (i.e. have roughly equal variance).
ANOVA is also fairly robust to the equal variances assumption, provided the samples are about the same size for all groups. For the cuckoo egg data set, the samples have very different sizes, so we can’t use that “get-out-of-jail-free” card.
To visually assess the variation among the groups, you can look at boxplots. The lengths of the boxes and the whiskers should be about the same for each group. (Graph > Boxplot > With Groups).
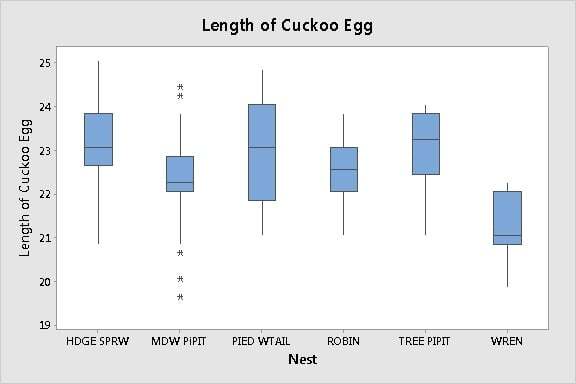
The boxplots indicate that the variation of the data in each group is “kinda sorta" the same. Some whiskers are definitely longer and some are shorter. The lengths of the boxes vary somewhat as well.
Is it enough to matter? The boxplots can't tell us.
A more rigorous way to compare the variation among the groups is to perform an equal variances test (Stat > ANOVA > Test for Equal Variances). Here are the results for the cuckoo egg data:
Method Test Statistic P-Value
Multiple comparisons — 0.476
Levene 0.64 0.670
For both tests, the p-value is not less than the alpha level of 0.05. Therefore, there’s not sufficient evidence to conclude that the variances are different. These data seem to satisfy the equal variances assumption.
But wait. Before you pop that champagne cork. Don't forget the small sample sizes (n = 15) in this data set.
The equal variances test, like the normality test, may not have enough power to detect differences in variance among the groups. You could be assuming the variances are equal only because you don't have enough data to prove they're not.
At this point, you may feel an Excedrin headache coming on.
Using the Minitab Assistant to Perform ANOVA
If you feel like you’re falling into a rabbit hole, struggling to evaluate the assumptions of the assumptions, you may want to drop by the Minitab Assistant to check what condition your condition is in.
To perform one-way ANOVA, choose Assistant > Hypothesis Tests > One-Way ANOVA. Then, click on the Report Card.
First, look at the Equal Variances check.
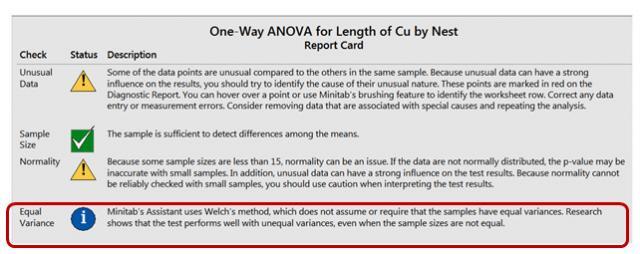
Say so-long to the homoscedastic heebie-jeebies! The report card informs you don’t need to worry about equal variances at all—even when your sample sizes are different. Sweet! That’s because the Assistant uses Welch’s method rather than an F- test. Welch’s method doesn’t require that the groups have equal variances.
Next, look at the Normality check.
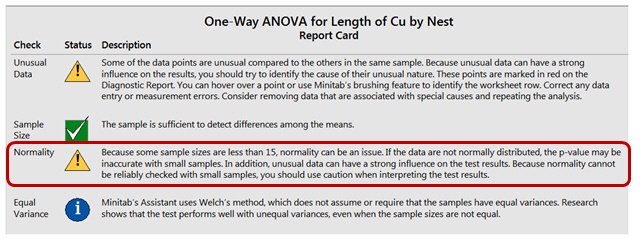
Here, the Assistant cautions that the small samples could be an issue for the normality assumption. But it also lets you know that normality can't be reliably checked with small samples—saving you time from pondering the imponderable.
More important, it gives a clear definitive answer to the question “What size samples do I need for robustness to the normality assumption?”
The minimum requirement for robustness to normality depends on the number of groups in your data. The sample size recommendation is based on tens of thousands of simulations performed by Minitab research statisticians to examine the Type I error rate when using Welch’s method to evaluate small and moderate size samples from nonnormal distributions.
There are two other checks on the report card—one for Sample Size, and one for Unusual Data. The Unusual Data check flags any outliers that could severely bias your results. The Sample Size check lets you know if you’ve collected enough data to provide the test with sufficient power to detect a difference in means.
These aren’t formal ANOVA assumptions, but they’re critical issues that can affect your results—and they’re often overlooked.
Independence
If you’re a careful reader, and you’re still with me, you’ve probably noticed I haven’t covered the formal ANOVA assumption of independence. It’s not because it’s not important—of all the assumptions, ANOVA is least robust to violations of independence.
But independence of the observations is affected by how you collect your data. To evaluate this assumption with 100% certainty, the Assistant would have to peek over your shoulder and watch you. The Assistant can’t do that.
Yet.
But it does provide a graph of the data points graphed in worksheet order. If you’ve entered your data in the worksheet in the sequence they were collected, this alerts you to any dependence in the data points collected close together in time or space. That’s one of most common types of dependence.
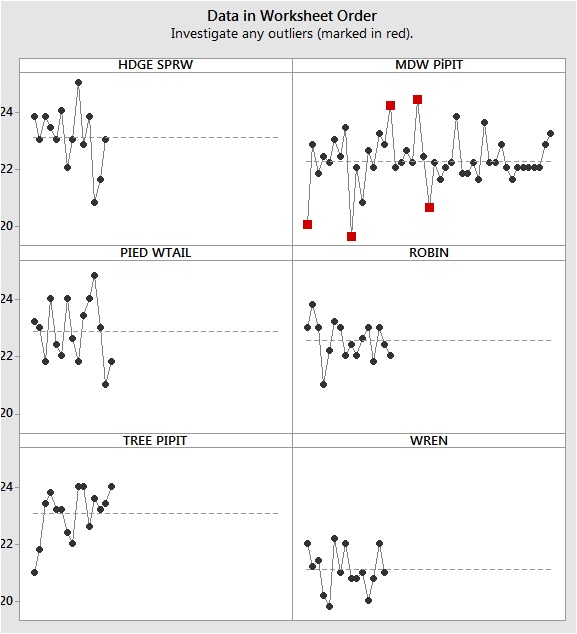
These data don't seem to show a time-order effect. However, notice the outliers flagged in the meadow pippit group. Those could be an issue.
Note: If you use classic One-Way ANOVA in Minitab, you can evaluate this assumption by looking at the residuals vs. order plot. If there’s a time-dependent pattern in the data points, there will be a time-dependent pattern in the errors.
Key Points
- Sample size is critical not just for providing power to the primary analysis, but for establishing robustness to some formal assumptions.
- If you don't know the formal assumptions for an analysis, or if you run into trouble trying to interpret them, consider using the Assistant.
- If your data are "borderline" for satisfying the ANOVA requirements, consider your application and its potential consequences. You may want to use a nonparametric test, such as Kruskall-Wallis or Mood's median test, to compare the medians of the groups rather than the means. Just remember—those tests have formal assumptions as well!