


Whenever something suddenly fell apart, my grandfather used to exclaim “Down goes the meat house!” I don’t know where that expression came from—as a child I often pictured a flabby house of raw meat caving in on itself. (This was decades before Lady Gaga made wearing raw meat dresses...uh...er... fashionable?)
My grandfather’s expression still pops into my head when I think about a probit analysis. A probit study is based on one very simple premise: Everything has its breaking point.
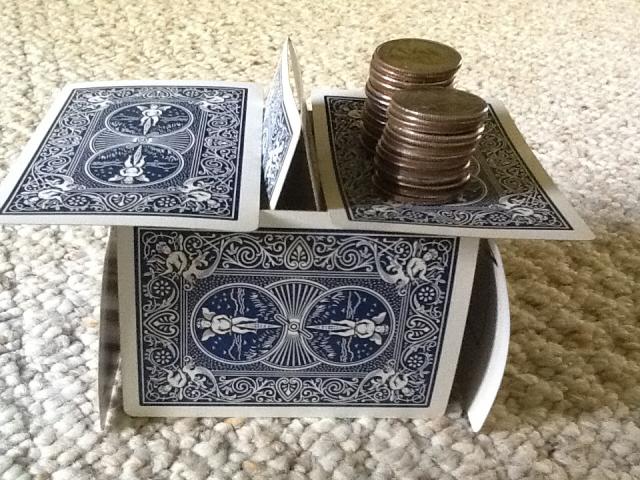
To illustrate this study, and to relive my childhood, I built some good old-fashioned card houses and tested how their roofs held up to stress loads of up to 50 U.S. quarters.
At each stress load, I tested 10 card houses and recorded how many collapsed. Here are the results, recorded in a Minitab worksheet:
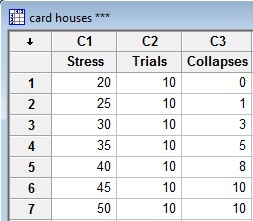
 Pretty simple, huh? The key thing to remember for this analysis is that the response variable is binary: the item fails (in this case, collapses) or it does not fail.
Before performing this study, I pretested card houses to determine the range of stress loads for the experiment. ("Mighty are the preparations!" was another favorite saying of my grandfather. And that's certainly true when you plan a statistical study!)
In a real application, you'd do preliminary research to determine the stress loads that an item is likely to be subjected to in practice.
You'd also want to make sure that all the stress tests are performed consistently and accurately. My tests were carefully monitored by a certified expert in destructive testing (shown at right).
The Minitab Results: How Reliable Are My Card Houses?
Here are the probit analysis results in Minitab (Stat > Reliability/Survival > Probit Analysis) for my card houses:
Regression Table
The regression table provides a model that relates the stress variable to the probability of failure.
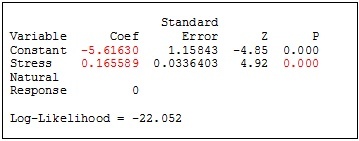
Because the P-value of 0.00 is less than the significance level of 0.05, the Stress variable (number of quarters) has a statistically significant effect on the risk of failure (cardhouse collapse).
The coefficient for Stress (0.16589) is positive, which means that an increase in the stress variable increases the risk of failure. (An obvious result here—but in other situations a stressor or stimulus may have ambiguous or unknown effects on the risk of failure that won't be so clearly apparent.)
The probability of roof collapse is given by the equation: F (-5.61630 + 0.165589*Stress), where F is cumulative distribution of the standard normal distribution (the assumed distribution for my data).
Goodness-of-Fit Tests
The goodness-of-fit tests indicate whether you can assume that the selected distribution for the probit analysis fits your data.
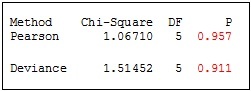
Both p-values are greater than the level of significance (0.05), so there's no evidence that the normal distribution doesn't fit my data.
Probability Plot
The probability plot helps you visually assess both the distribution fit and the relationship between the stress load and the percentage of items that fail (middle line).
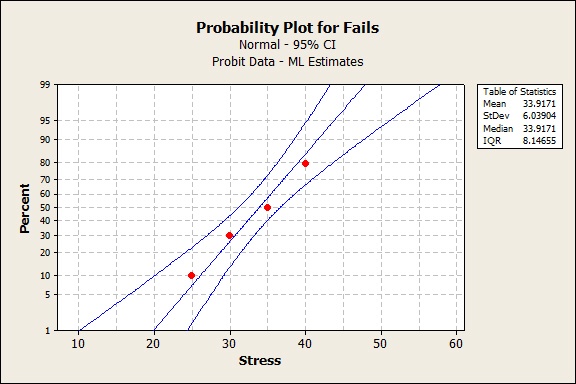
The middle line fits the data well, and shows the risk of card-house collapse as the stress load increases. For example, a card house with a load of 32 quarters has about a 40% chance of collapsing.
The width of the two outer lines (the 95% confidence bands) indicates how certain you can be of the estimated risk of failure. Your risk estimate is more precise where the bands are narrower—here, for stress loads between 30 and 40 quarters. Your risk estimate is less precise where the bands are wider; in this case, for loads less than 30 quarters or greater than 40 quarters.
Table of Percentiles
This table gives you the exact estimated values for the percentage of items that fail at various stress loads.
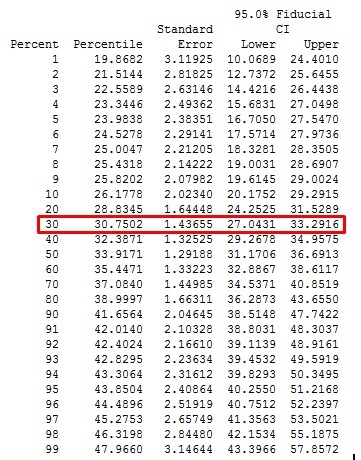
You can use these results to determine at which stress levels you can be 95% confident that a certain percentage of items will survive. For example, the highlighted results indicate that I can be 95% confident that the stress load at which 70% of the cardhouses will still be standing falls between about 27 and 33 quarters.
When a Meat House Goes Down, What's at Stake?
My card houses are largely unoccupied. So the risk of a collapse is of no great consequence, unless you're an errant, zig-zagging member of the Formicidae family.
But in other scenarios, the consequence of the proverbial meat house going down are much more critical.
Think of product safety. A manufacturer of aircraft windshields needs to determine how well a particular windshield can withstand a projectile impact at a range of velocities.
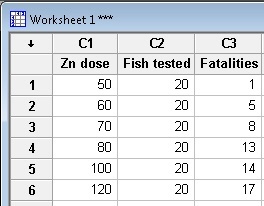
Or consider a real "house of cards"—the environment. Probit analyes are often performed to determine the impact of industrial pollutants on the fatality rates of local wildlife. Here's a typical example: a probit study on how well catfish can survive exposure to increasing doses of a heavy metal (zinc).
To practice, use the data from this paper and analyze it in Minitab.
- Enter the data in a Minitab worksheet. These data are from Table 2 in the study, and show the effects of zinc exposure on the fish after 96 hours.
- Choose Stat > Reliability/Survival > Probit Analysis.
- In Number of Events, enter Fatalities; in Number of Trials, enter Fish Tested; and in Stress(Stimulus), enter Zn dose.
- From Assumed distribution, choose lognormal (that's what the researchers used in their study).
- Click OK.
Your results in Minitab—specifically the Table of Percentiles—should match those shown in Table 4 in the study.
Notice the result at the 50th percentile? That's often used as a benchmark value in a probit study. It defines the stress load at which 50% of the items will fail. In this data, approximately 50% of the fish will not survive when exposed to a concentration of zinc at 78.2 mg/l.
My grandpa might have interpreted the 50th percentile this way: it's the tipping point at which you can expect about half of your meat houses to go down.
Case study:
Time-to-Market and Design for Reliability at the Speed of Light in Signify
Get ready for a light bulb moment! In a fast-changing industry where time-to-market and product reliability give a competitive edge, discover how the world’s leading lighting company Signify, rapidly validates new innovations. In this one hour webinar, Prof W.D. van Driel and Dr P. Watté will shed a light on design for reliability (DfR) using Minitab Statistical Software at Signify, the former Philips Lighting. Learn from real-life examples their methods to lower your development costs, improve your designs’ performance and compliance, and accelerate the testing of product design reliability. If you develop products intended to meet high specifications for years to come, you will discover how to reduce the risks and consequences of product failure and costly claims - for you and your customers.

![[Webinar Replay] Time-to-Market and Design for Reliability at the Speed of Light at Signify](https://no-cache.hubspot.com/cta/default/3447555/b70a5a3e-03b6-408b-bbc1-7851ef13e4e9.png)