


I collected my first block of data for the gummi bear design of experiments this week. Why not all of it? Well, there’s lots you can learn when you start collecting data for real. Here are some of my thoughts:
Enter data quickly and accurately for design of experiments
If you’re going to do anything with your data, it’s a lot easier to have it in Minitab. If you followed my lead for doing design of experiments, you have a piece of paper that looks like this:
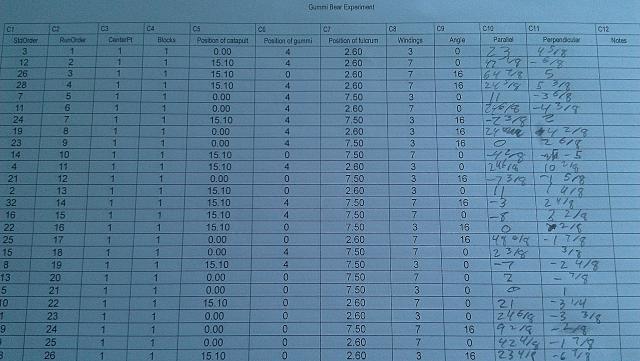
Accuracy will be much easier if the same person who wrote the data also enters it in the computer, so they can figure out if that number in row two is 42 or 47.
As I collected the data, I wrote even familiar fractions, like 1/4th, in eighths. That’s to simplify typing in Minitab for those of us who still have to think about the decimal representation of 7/8ths. Instead of typing into my response columns, I made 2 additional columns for each response:
- The whole number of inches (whole par)
- The number of eighth inches (eighths par)
Then, I used a formula to get the total in Minitab:
‘whole par’ + ‘eighths par’/8
Hopefully, this trick saves you some time because it involves typing 3 fewer characters for every eighth!
If you use my data entry formula, you have to be careful to write both numbers as negative if the measurement is negative. This formula checks both of my response columns at the same time:
if('whole par'*'eighths par'>=0 and 'whole per'*'eighths per'>=0, 0, 1)
Check the data for design of experiments
Once you have the data, Minitab’s Graphical Summary is a great place to do some basic checks. Here’s what my first one looked like.
You always want to check the outliers. The statistics in design of experiments rely on means and standard deviations, which can change dramatically if incorrect data is in the analysis. This time, it turns out that there really was a 64 and 7/8ths inch measurement, but it's best to verify.
There is a problem though. If you are familiar with how many data points should be in the first block of the experiment, you noticed that N = 31 instead of N = 33. When I was copying, I wrote the data in line 6, then picked up writing again in line 9, below the next row that started with a 24. That’s a big error. If I analyze the data with 31 runs, the Minitab results include two notes show there's a problem:
* NOTE * There is partial confounding, no alias table was printed.
* NOTE * This design is not orthogonal.
Neither of these two statements should ever apply to a full factorial design. Even worse, my response values didn’t line up with the correct factor combinations after row 6. None of my analysis would have been correct.
The last thing I learned is that setting up my catapult over and over again is hard on the rubber band. My rubber band broke after I took it off for the very last trial.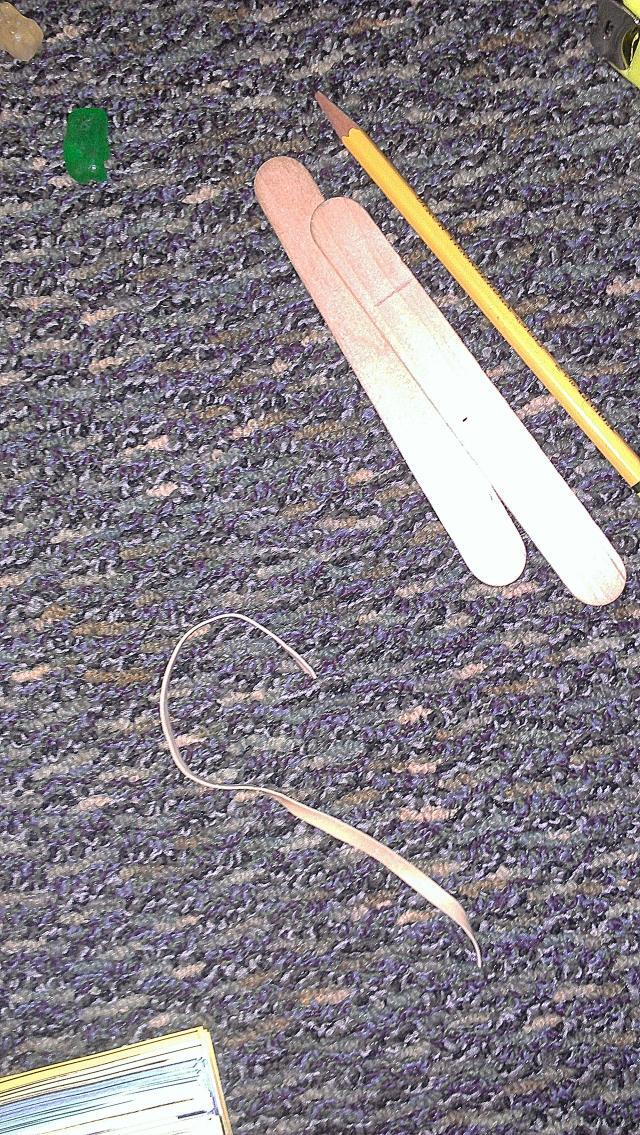
I thought that I could probably get away with using one rubber band for a full block, but I wonder if the next one will last 33 runs. I might need to randomize the rubber band so that it doesn't wear out. I’ll have to decide which problem is worse: the rubber band wearing out or the variation I introduce by changing rubber bands.
Summary
Here are some questions to think about before and during your data collection for design of experiments:
- How can I get the data into Minitab quickly and accurately?
- Are there outliers in the data? Should the outliers stay in the analysis?
- Is there unwanted variation in my study?
Have your own tips to share? Let me know!
And if you can't get enough of checking data, see how the always-entertaining Patrick Runkel uses Minitab to weed out bloopers in data.