


Minitab graphs are powerful tools for investigating your process further and removing any doubt about the steps you should take to improve it. With that in mind, you’ll want to know every feature about Minitab graphs that can help you share and communicate your results effectively. While many ways to modify your graph are on the Editor menu, some of the best features become available when you right-click your graph.
Here are the five coolest things you can do when you right-click a graph in Minitab Statistical Software.
Send graph to...
Once your graph is ready for your report or presentation, you’ll want to put the graph in your document. Minitab makes this easy because you can right-click your graph and select either Send Graph to Microsoft Word or Send Graph to Microsoft PowerPoint. With that, you’re all set to go.
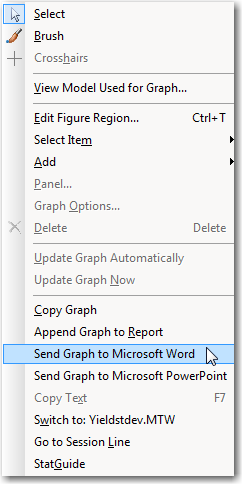
When you use the Minitab menu to transfer your graph to a presentation document, Minitab automatically selects the format that provides the clearest graph. In the case of PowerPoint, Minitab also makes sure that the graph is automatically fit to fill the receiving slide.
Get Help with Interpretation
Getting your graph into a report is an important step, but you also want to be ready to explain your results. That’s where Minitab Help comes into play. Right-click your graph, and the last menu item is always going to Help. Select that, and you’ll be taken directly to a page about the graph that you’re examining. Minitab saves you the time you would have spend looking for information about the output so that you have more time to get things done.
Copy Text
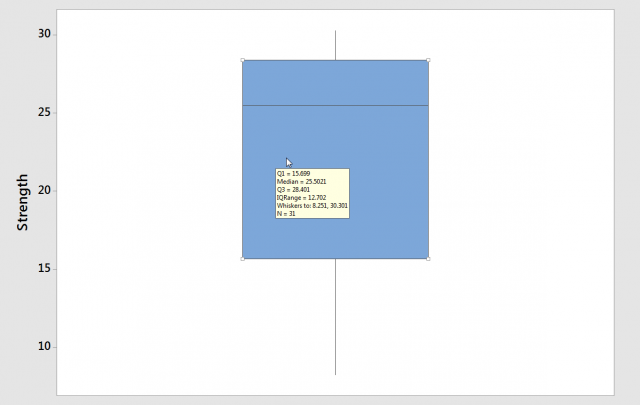
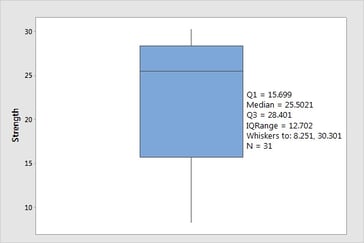
Graphs are excellent tools for exploring and communicating, but that doesn’t mean that you never want to see the exact numbers. Getting the numbers from a graph is as easy as selecting an individual component and choosing Copy Text.
For example, you have a boxplot and would like to see the exact statistics for the graph. The tooltip for the boxplot includes the mean, quartiles, minimum, maximum, interquartile range, and sample size. Select the box with a right-click and Copy Text is active in the context menu. You can even paste a text box directly onto the graph with the information from the tooltip!
Switch to worksheet
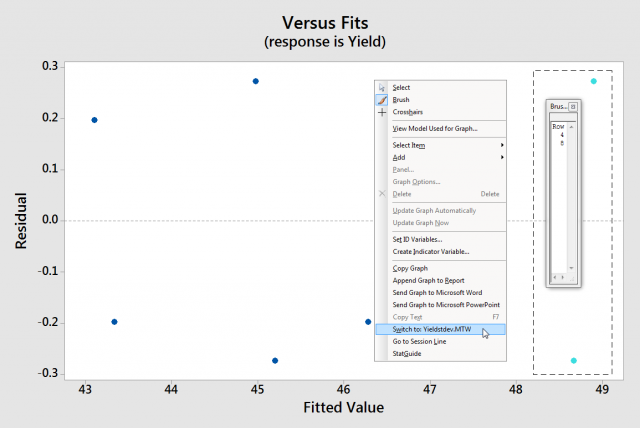
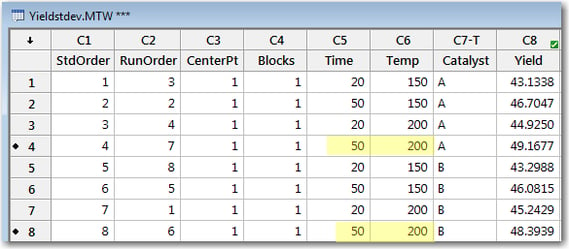
If you have a lot of graphs open, your Minitab window can sometimes get a little full. On those occasions, the right-click menu makes it easy for you to compare what you see on your graph with what’s in your data. For example, say that you’re looking at a residuals vs. fits plot and you brush the rows with the largest fits. Right-click the graph and choose Switch to, and you can quickly match up the brushed rows with the data on your graph. Here, you can easily see that while the catalyst changes between rows 4 and 8, the settings for time and temperature are the same.
Go to Session Line
Sometimes you have to produce a lot of output in Minitab to understand your data. When you get a mix of lots of statistics and graphs, you’ll want to be able to easily find the Coefficients table for a particular residual plot or the p-value for a t-test shown on a specific individual value plot. Right-clicking a graph can save you again. When you right-click and select Go to Session Line, you’re taken to the portion of the session window where the graph was made. Any tables or statistics that Minitab produced at the same time as the graph are right above that point in the session window!
Ready to go
Graphs are an important tool for making sure that everyone understands the results of your data analysis. When you right-click a graph in Minitab, you’ll find a number of tools that make it easier to share and understand your results. The right-click menu is one more step on your path to fearless data analysis.