


As a recent graduate from Arizona State University with a degree in Business Statistics, I had the opportunity to work with students from different areas of study and help analyze data from various projects for them.
One particular group asked for help analyzing online survey data they had gathered from other students, and they wanted to see if their new student program was beneficial. I would describe this request as them giving us a "pile of data" and saying, "Tell us what you can find out."There were numerous problems with this "pile of data" because it wasn't organized, in part because of the way the survey itself was set up. (Our statistics professor later told us that she asked this group to come in because she'd looked at their data before they presented it to us and she wanted to see how we would perform with a "real-world" situation.)
Unfortunately, the statistics department didn't have a time machine that would enable us to go back and set up the survey to have better data that was more organized (I guess if we did have a time machine there would be no need for predictive analytics), but we did have Minitab and its tools to help with the importing of data, reviewing the data, and putting it in a format that is best for analyzing.
So let’s assume you have a pile of survey data that is:
- Unbiased
- Taken from a random sample
- Taken from the appropriate audience
- Contained enough respondents
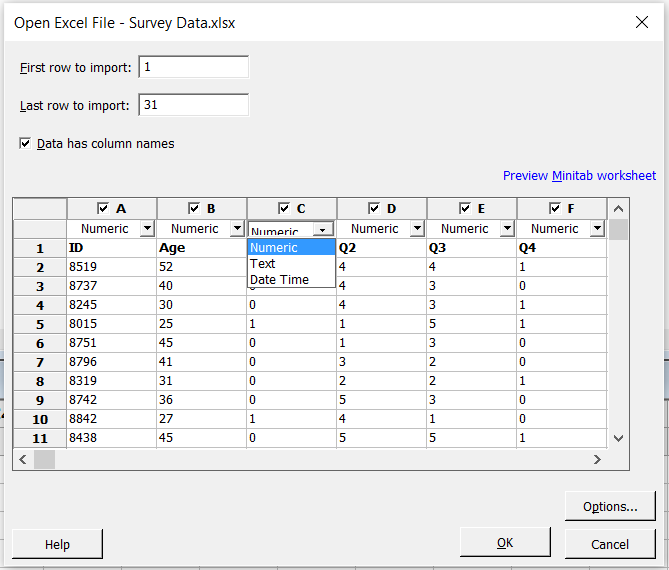
Many online survey tools allow you to download your data to a .csv or Excel file, which would be perfect to import into Minitab.
In fact, Minitab has a dialog box that shows you the data before it is opened so you can modify the data type, include/exclude certain columns, and see how many rows are within the data. Within options of that same dialog box you are able to choose what is done with missing data points, and missing data rows. All of these new functions give you the ability to bring a "pile of data" into Minitab a little cleaner with less headache.
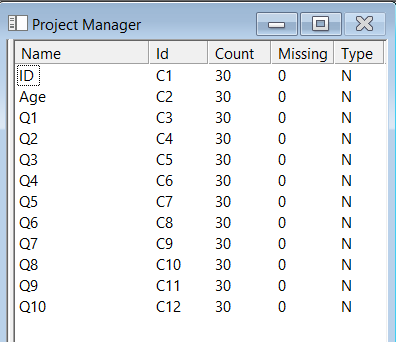
Once the data is in Minitab reviewing the data is essential to uncover any irregularities that may be hiding in the data before analysis. Within the Project Manager Bar there is the information icon that allows you to be able to see each column name, column ID, row count, how many missing data points and the type of data of each column. This provides the ability to quickly scan the different columns to make sure that the online data you received correctly by checking the row count, any missing data irregularities, and data type.
Minitab also has numerous tools to format the data before analysis, including coding, sorting and splitting worksheets.
For example, occasionally survey data will use “0” in the place of a non-response. This can be a problem because any data analysis will make this a data point when it probably shouldn't be. Minitab can find those “0”s and replace them with missing data to remove them from your worksheet so they won't throw off your analysis (Editor > Find and Replace > Replace).
Before analysis you can also sort your data (Data > Sort) and choose the column you would like to sort the data to, and you can also create a new worksheet from the sorted data. I also really like the Split and Subset Worksheet options in the event you have a lot of data and it would be easier to look at smaller sections of it for analysis (Data > Split Worksheet and Data > Subset Worksheet).
These are just a few tools that allow you to import data and then prepare the data without having to go back and forth between your spreadsheet software and statistical software. So when you have someone drop off a "pile of data," see how you can use your Minitab tools to shovel through and find the gems that are lying beneath the surface.