


by Matthew Barsalou, guest blogger
Aaron and Billy are two very competitive—and not always well-behaved—eight-year-old twin brothers. They constantly strive to outdo each other, no matter what the subject. If the boys are given a piece of pie for dessert, they each automatically want to make sure that their own piece of pie is bigger than the other’s piece of pie. This causes much exasperation, aggravation and annoyance for their parents. Especially when it happens in a restaurant (although the restaurant situation has improved, since they have been asked not to return to most local restaurants).
Sending the boys to their rooms never helped. The two would just compete to see who could stay in their room longer. This Christmas their parents were at wits' ends, and they decided the boys needed to be taught a lesson so they could grow up to be upstanding citizens. Instead of the new bicycles the boys were going to get—and probably just race till they crashed anyway—their parents decided to give them each a bag of coal.
An astute reader might ask, “But what does this have to do with Minitab?” Well, dear reader, the boys need to figure out who got the most coal. Immediately upon opening their packages, the boys carefully weighed each piece of coal and entered the data into Minitab.
Then they selected Stat > Basic Statistics > Display Descriptive Statistics and used the "Statistics" options dialog to select the metrics they wanted, including the sum of the weights they'd entered:
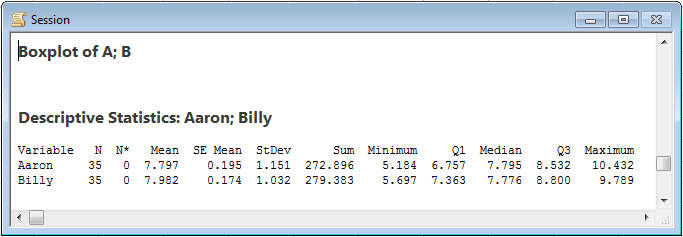
Billy quickly saw that he had the most coal, and yelled, “I have 279.383 ounces and you only have 272.896 ounces, and the mean of my pieces of coal is more than the mean of yours. Mine weigh more, so our parents must love me more.”
“Not so fast,” said Aaron. “You may have a higher mean value, but is the difference statistically significant?” There was only one thing left for the boys to do: perform a two sample t-test.
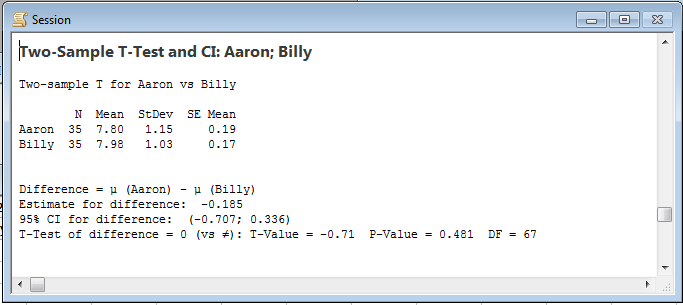
In Minitab, Aaron selected Stat > Basic Statistics > 2-Sample t…
The boys left the default values at a confidence level of 95.0 and a hypothesized difference of 0. The alternative hypothesis was “Difference ≠ hypothesized difference” because the only question they were asking was “Is there a statistically significant difference?” between the two data sets.
The two troublemakers also selected “Graphs” and checked the options to display an individual value plot and a boxplot. They knew they should look at their data. Having the graphs available would also make it easier for them to communicate their results to higher authorities, in this case, their poor parents.
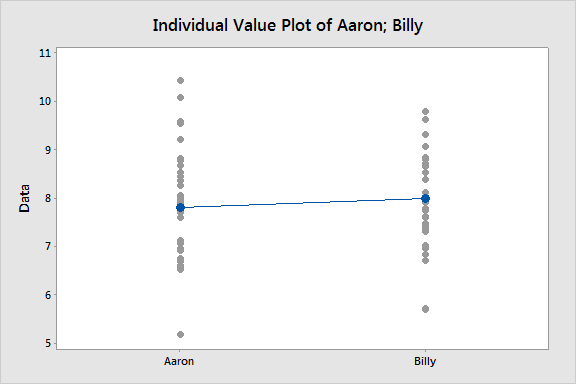
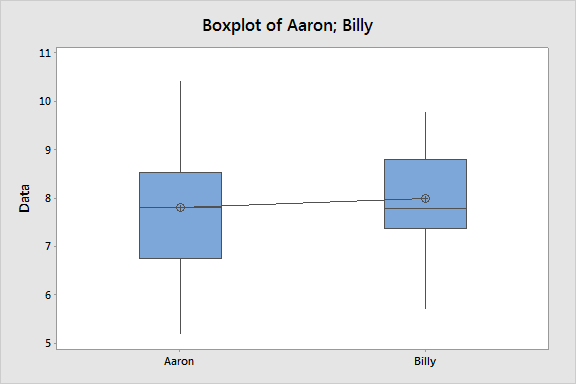
Both the individual value plots and boxplots showed that Aaron's bag of coal had pieces with the highest individual weights. But he also had the pieces with the least weight. So the values for his Christmas coal were scattered across a wider range than the values for Billy‘s Christmas coal. But was there really a difference?
Billy went running for his tables of Student‘s t-scores so he could interpret the resulting t-value of -0.71. Aaron simply looked at the resulting p-value of 0.481. The p-value was greater than 0.05 so the boys could not conclude there was a true difference in the weight of their Christmas "presents."
The boys dutifully reported the results, with illustrative graphs, each demanding that they get a little more to best the other. Clearly, receiving coal for Christmas had done nothing to reduce their level of competitiveness. Their parents realized the boys were probably not going to grow up to be upstanding citizens, but they may at least become good statisticians.
Happy Holidays.
About the Guest Blogger
Matthew Barsalou is a statistical problem resolution Master Black Belt at BorgWarner Turbo Systems Engineering GmbH. He is a Smarter Solutions certified Lean Six Sigma Master Black Belt, ASQ-certified Six Sigma Black Belt, quality engineer, and quality technician, and a TÜV-certified quality manager, quality management representative, and auditor. He has a bachelor of science in industrial sciences, a master of liberal studies with emphasis in international business, and has a master of science in business administration and engineering from the Wilhelm Büchner Hochschule in Darmstadt, Germany. He is author of the books Root Cause Analysis: A Step-By-Step Guide to Using the Right Tool at the Right Time, Statistics for Six Sigma Black Belts and The ASQ Pocket Guide to Statistics for Six Sigma Black Belts.