


By Matthew Barsalou, guest blogger
A problem must be understood before it can be properly addressed. A thorough understanding of the problem is critical when performing a root cause analysis (RCA) and an RCA is necessary if an organization wants to implement corrective actions that truly address the root cause of the problem. An RCA may also be necessary for process improvement projects; it is necessary to understand the cause of the current level performance before attempts are made to improve the performance.
Many statistical tests related to problem-solving can be performed using Minitab Statistical Software. However, the actual test you select should be based upon the type of data you have and what needs to be understood. The figure below shows various statistical options structured in a cause-and-effect diagram with the main branches based on characteristics that describe what the tests and methods are used for.
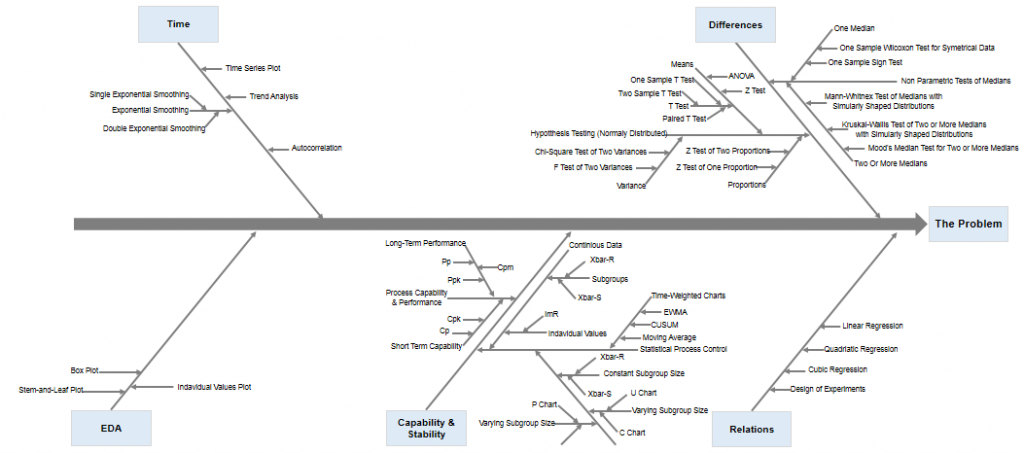
The main branch labeled “differences” is split into two high-level sub-branches: hypothesis tests that have an assumption of normality, and non-parametric tests of medians. The hypothesis tests assume data is normally distributed and can be used to compare means, variances, or proportions to either a given value or to the value of a second sample. An ANOVA can be performed to compare the means of two or more samples.
The non-parametric tests listed in the cause-and-effect diagram are used to compare medians, either to a specified value, or two or more medians, depending upon which test is selected. The non-parametric tests provide an option when data is too skewed to use other options, such as a Z-test.
Time may also be of interest when exploring a problem. If your data are recorded in order of occurrence, a time series plot can be created to show each value at the time it was produced; this may give insights into potential changes in a process.
A trend analysis looks much like the time series plot; however, Minitab also tests for potential trends in the data such as increasing or decreasing values over time. Exponential smoothing options are available to assign exponentially decreasing weights to the values over time when attempting to predict future outcomes.
Relationships can be explored using various types of regression analysis to identify potential correlations in the data such as the relationship between the hardness of steel and the quenching time of the steel. This can be helpful when attempting to identify the factors that influence a process. Another option for understanding relationships is Design of Experiments (DoE), where experiments are planned specifically to economically explore the effects and interactions between multiple factors and a response variable.
Another main branch is for capability and stability assessments. There are two main sub-branches here; one is for measures of process capability and performance and the other is for Statistical Process Control (SPC), which can assess the stability of a process.
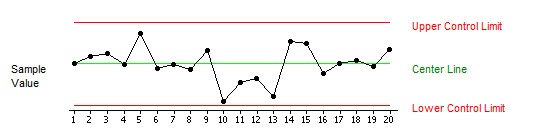
The measures of process performance and capability can be useful for establishing the baseline performance of a process; this can be helpful in determining of process improvement activities have actually improved the process. The SPC sub-branch is split into three lower-level sub-branches; these are control charts for attribute data such as number of defective units, control charts for continues data such as diameters, and time-weighted charts that don’t give all values equal weights.
Control charts can be used for both assessing the current performance of a process such as by using an individual’s chart to determine if the process is in a states of statistical control, or for monitoring the performance of a process such as after improvements have been implemented.
Exploratory data analysis (EDA) can be useful for gaining insights to the problem using graphical methods. The individual values plot is useful for simply observing the position of each value relative to the other values in a data set. For example, a box plot can be helpful when comparing the means, medians and spread of data from multiple processes. The purpose of EDA is not to form conclusions, but to gain insights that can be helpful in forming tentative hypotheses or in deciding which type of statistical test to perform.
The tests and methods presented here do not cover all available statistical tests and methods in Minitab; however, they do provide a large selection of basic options to choose from.
These tools and methods are helpful when exploring a problem, but their use should not be limited to problem exploration. They can also be helpful for planning and verifying improvements. For example, an individual value plot may indicate one process performs better than a comparable process, and this can then be confirmed using a two-sample t test. Or, the settings of the better process can be used to plan a DoE to identify the optimal settings for the two processes and the improvements can be monitored using an xBar and S chart for the two processes.
About the Guest Blogger
Matthew Barsalou is a statistical problem resolution Master Black Belt at BorgWarner Turbo Systems Engineering GmbH. He is a Smarter Solutions certified Lean Six Sigma Master Black Belt, ASQ-certified Six Sigma Black Belt, quality engineer, and quality technician, and a TÜV-certified quality manager, quality management representative, and auditor. He has a bachelor of science in industrial sciences, a master of liberal studies with emphasis in international business, and has a master of science in business administration and engineering from the Wilhelm Büchner Hochschule in Darmstadt, Germany. He is author of the books Root Cause Analysis: A Step-By-Step Guide to Using the Right Tool at the Right Time, Statistics for Six Sigma Black Belts and The ASQ Pocket Guide to Statistics for Six Sigma Black Belts.