


by Matthew Barsalou, guest blogger.
E. E. Doc Smith, one of the greatest authors ever, wrote many classic books such as The Skylark of Space and his Lensman series. Doc Smith’s imagination knew no limits; his Galactic Patrol had millions of combat fleets under its command and possessed planets turned into movable, armored weapons platforms. Some of the Galactic Patrol’s weapons may be well known. For example, there is the sunbeam, which concentrated the entire output of a sun’s energy into one beam.
The Galactic Patrol also created the negasphere, a planet-sized dark matter/dark energy bomb that could eat through anything. I’ll go out on a limb and assume that they first created a container that could contain such a substance, at least briefly.
When I read about such technology, I always have to wonder “How did they test it?” I can see where Minitab Statistical Software could be very helpful to the Galactic Patrol. How could the Galactic Patrol evaluate smaller, torpedo-sized units of negasphere? Suppose negasphere was created at the time of firing in a space torpedo and needed to be contained for the first 30 seconds after being fired, lest it break containment early and damage the ship that is firing it or rupture the torpedo before it reaches a space pirate.
The table below shows data collected from fifteen samples each of two materials that could be used for negasphere containment. Material 1 has a mean containment time of 33.951 seconds and Material 2 has a mean of 32.018 seconds. But is this difference statically significant? Does it even matter?
|
Material 1 |
Material 2 |
|
34.5207 |
32.1227 |
|
33.0061 |
31.9836 |
|
32.9733 |
31.9975 |
|
32.4381 |
31.9997 |
|
34.1364 |
31.9414 |
|
36.1568 |
32.0403 |
|
34.6487 |
32.1153 |
|
36.6436 |
31.9661 |
|
35.3177 |
32.0670 |
|
32.4043 |
31.9610 |
|
31.3107 |
32.0303 |
|
34.0913 |
32.0146 |
|
33.2040 |
31.9865 |
|
32.5601 |
32.0079 |
|
35.8556 |
32.0328 |
The questions we're asking and the type and distribution of the data we have should determine the types of statistical test we perform. Many statistical tests for continuous data require an assumption of normality, and this can easily be tested in our statistical software by going to Graphs > Probability Plot… and entering the columns containing the data.
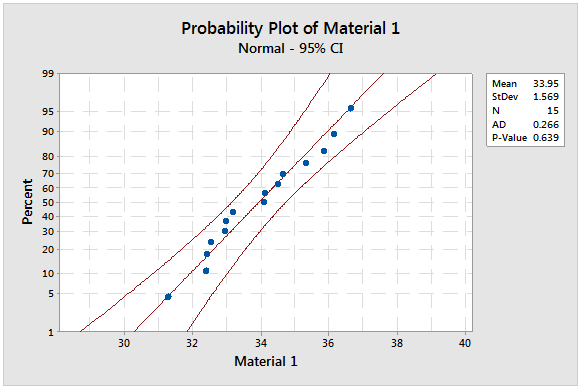
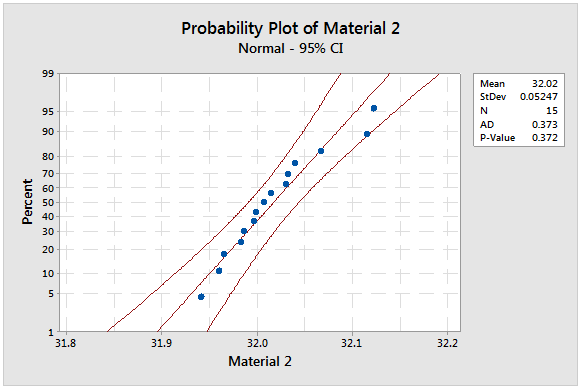
The null hypothesis is “the data are normally distributed,” and the resulting P-values are greater 0.05, so we fail to reject the null hypothesis. That means we can evaluate the data using tests that require the data to be normally distributed.
To determine if the mean of Material 1 is indeed greater than the mean of Material 2, we perform a two sample t-test: go to Stat > Basic Statistics > 2 Sample t… and select “Each sample in its own column.” We then choose “Options..” and select “Difference > hypothesized difference.”
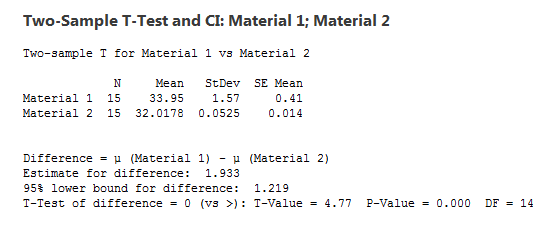
The P-value for the two sample t-test is less than 0.05, so we can conclude there is a statistically significant difference between the materials. But the two sample t-test does not give us a complete picture of the situation, so we should look at the data by going to Graph > Individual Value Plot... and selecting a simple graph for multiple Y’s.
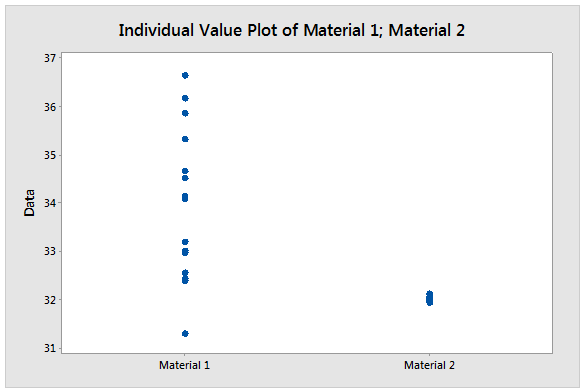
The mean of Material 1 may be higher, but our biggest concern is identifying a material that does not fail in 30 seconds or less. Material 2 appears to have far less variation and we can assess this by performing an F-test: go to Stat > Basic Statistics > 2 Variances… and select “Each sample in its own column.” Then choose “Options..” and select “Ratio > hypothesized ratio.” The data is normally distributed, so put a checkmark next to “Use test and confidence intervals based on normal distribution.”
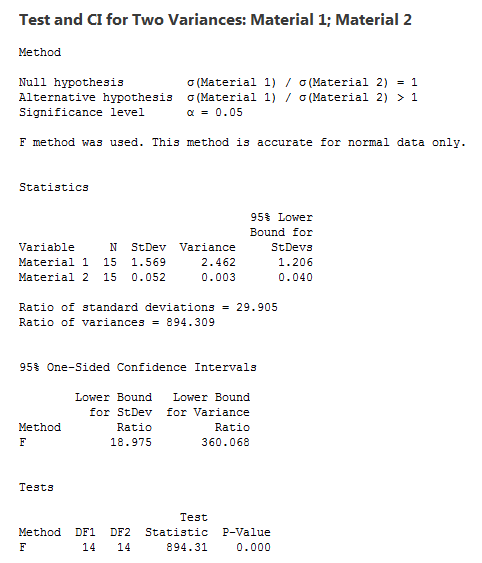
The P-value is less than 0.05, so we can conclude the evidence does supports the alternative hypothesis that the variance of the first material is greater than the variance of the second material. Having already looked at a graph of the data, this should come as no surprise
No statistical software program can tell us which material to choose, but Minitab can provide us with the information needed to make an informed decision. The objective is to exceed a lower specification limit of 30 seconds and the lower variability of Material 2 will achieve this better than the higher mean value for Material 1. Material 2 looks good, but the penalty for a wrong decision could be lost space ships if the negasphere breaches its containment too soon, so we must be certain.
The Galactic Patrol has millions of ships so a failure rate of even one per million would be unacceptably high so we should perform a capability study by going to Quality Tools > Capability Analysis > Normal… Enter the column containing the data for Material 1 and use the same column for the subgroup size and then enter a lower specification of 30. This would then be repeated for Material 2.
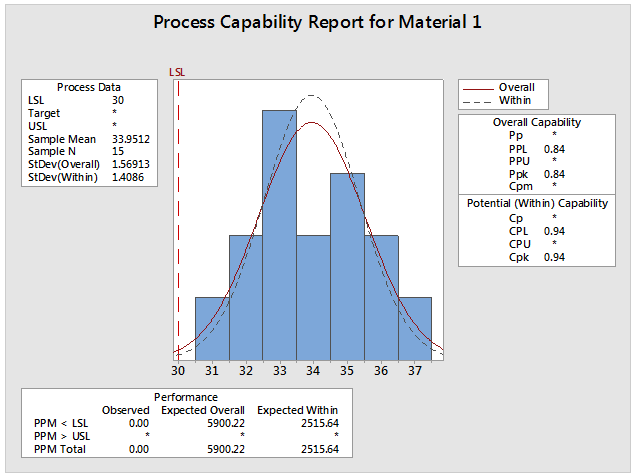
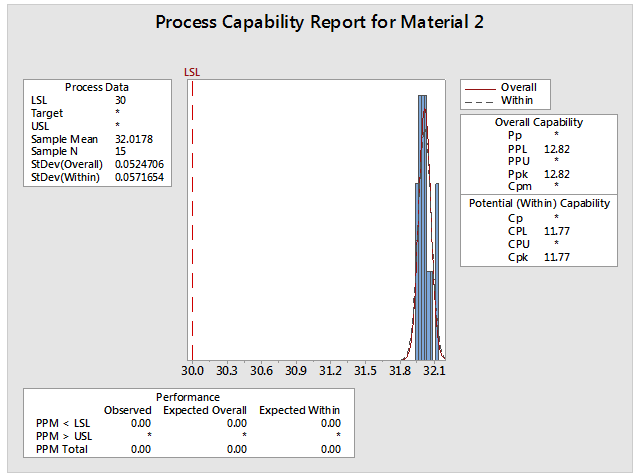
Looking at the Minitab generated capability studies, we can see that Material 1 can be expected to fail thousands of times per million uses, but Material 2 would is not expected to fail at all. In spite of the higher mean, the Galactic Patrol should use Material 2 for the negaspehere torpedoes.
About the Guest Blogger
Matthew Barsalou is a statistical problem resolution Master Black Belt at BorgWarner Turbo Systems Engineering GmbH. He is a Smarter Solutions certified Lean Six Sigma Master Black Belt, ASQ-certified Six Sigma Black Belt, quality engineer, and quality technician, and a TÜV-certified quality manager, quality management representative, and auditor. He has a bachelor of science in industrial sciences, a master of liberal studies with emphasis in international business, and has a master of science in business administration and engineering from the Wilhelm Büchner Hochschule in Darmstadt, Germany. He is author of the books Root Cause Analysis: A Step-By-Step Guide to Using the Right Tool at the Right Time, Statistics for Six Sigma Black Belts and The ASQ Pocket Guide to Statistics for Six Sigma Black Belts.