


Even the best NHL goalies can get pulled several times each season. Do they really have cold streaks, or is a drop in save percentage on a given day part of normal random variation?
My colleague Doug Gorman and I decided to find out using our favorite statistical software package.
Control Charts for Coaching Decisions
We used a control chart approach to determine if coaching decisions to pull goalies are supported by sound statistical rules, or if they seem to be more emotional reactions.
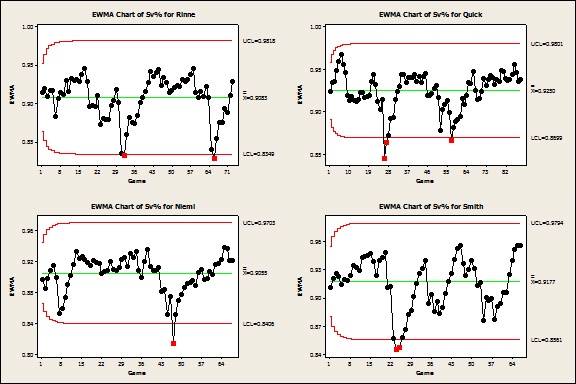
We generated 3-sigma lower control limits for each of 10 goalies based on their 2011-2012 game-by-game save percentages. Then we created an EWMA (exponentially weighted moving average) chart to help determine if there were longer-term trends or shifts in a goalie’s save percentage.
EWMA charts can detect smaller shifts or trends in the data over time better than the classic Shewhart control charts. Hitting the lower control limit in an EWMA chart is evidence that a negative shift in the save percentage (in other words, a cold spell) has been identified.
The plotting points for the EWMA charts shown here are exponentially weighted moving averages of a goalie’s save percentages. The more recent games are given more weight in the average.
The EWMA* charts identified the following goalies as having non-random save percentage trends over time:
- Pekka Rinne, Nashville Predators
- Jonathan Quick, Los Angeles Kings
- Antti Niemi, San Jose Sharks
- Mike Smith, Phoenix Coyotes
Monitoring Streaky Goalies
Being identified as a streaky goalie isn’t necessarily a bad thing. Jonathan Quick was on a hot streak during the 2012 NHL playoffs and his team, the Los Angeles Kings, won the Stanley Cup in 2012 as an 8th seed! However, coaches should monitor streaky goalies more closely and establish a rule about when to pull the goalie. Due to the cold spells that streaky goalies encounter, there may be justification to pull these goalies even more quickly (for example, using a 2.5 sigma limit).
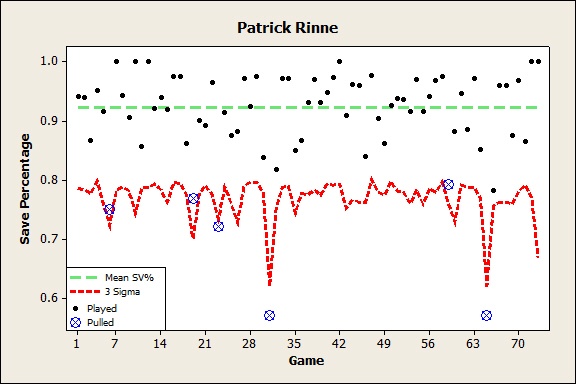
Consider Pekka Rinne, who had statistically significant cold spells according to his EWMA chart. His coach, Barry Trotz, pulled him six times. Each time Rinne was pulled, his save percentage was very near the 3-sigma limit. The time-series plot below shows that Trotz was amazingly consistent with principles of randomness and statistical process control.
According to the EWMA charts, the following goalies can be defined as steady:
- Jonas Hiller, Anaheim Ducks
- Miikka Kurprusoff, Calgary Flames
- Cam Ward, Carolina Hurricanes
- Ondrej Pavelec, Winnipeg Jets
- Carey Price (amazingly steady), Montreal Canadians
- Marc-Andre Fluery (to the surprise of many Penguin fans), Pittsburgh Penguins.
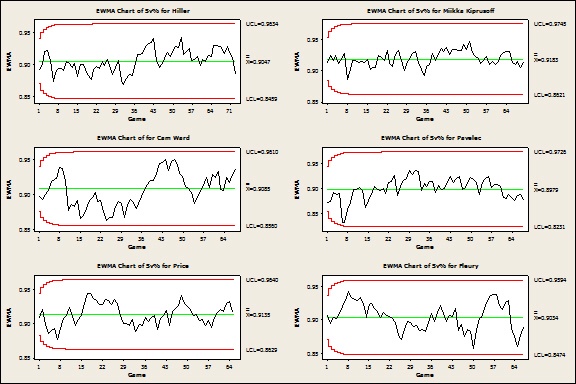
These goalies demonstrated consistency throughout the 2011-2012 regular season. Pulling one of them and putting in a back-up may not be the best course of action.
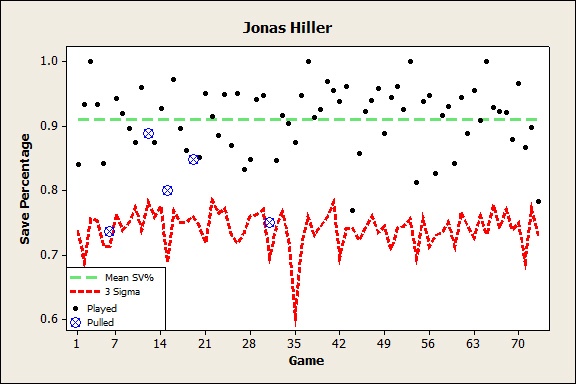
Consider Jonas Hiller, who was pulled five times during the 2011-2012 regular season. None of the save percentages in the pulled games were beyond the 3-sigma lower limit. Depending on how skilled his back-up was, it might have been advisable to leave Jonas in goal a bit longer before pulling.
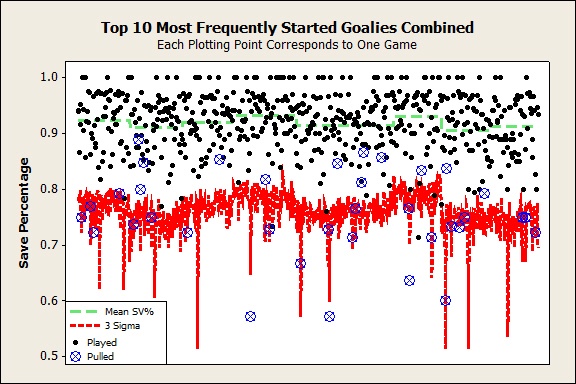
To get a better understanding of when coaches pull goalies in general, the graph below shows how close to the 3-sigma lower limit a goalie’s saved percentage needs to be before that goalie gets pulled. The graph includes data from the top 10 most frequently started goalies during the 2011-2012 regular season.
A more advanced analysis could take into account:
- How goals were scored.
Were they power-play goals? Were they softies? This is somewhat subjective.
- The opponent’s ability to score goals.
An opponent who gets more shots on goal has been taken into account by the nature of the save percentage response. However, some teams/players may have better shot accuracy than others.
*Note, the EWMA chart assumes the sample size (number of shots a goalie faces) for the save percentages that make up each weighted average are the same from one moving average to another. This assumption does not hold exactly, but since each weighted average is based on save percentages that have similar sample sizes, we will still use the chart in this analysis.