I previously started looking into which method of gambling was your best bet: a NFL bet, a number on a roulette wheel, or a scratch-off lottery ticket. After calculating the expect value for each one, I found out that the NFL bet and roulette bet were similar, as each had an expected value close to -$0.50 on a $10 bet. The scratch-off ticket was much worse, having an expected value of -$2.78.
But I want see how each of these games could play out in real life. After all, it is possible for people to come out ahead playing each game. So I planned to take 300 people, split them into 3 groups (one for each game), and have each group make a $10 bet once a day for a year.
After a failed attempt to find 300 friends, family members, and coworkers to agree to gamble $10 a week for a year, I realized I was going to have to simulate the gambling myself. Luckily Minitab Statistical Software has a set of tools that made this very easy! So I’m going to show you exactly how I did. Then you, too, can start your own underground casino...uh, I mean, run an experiment to see how different types of bets play out in the long run.
We better just get to the simulation. If you want to follow along and don't already have it, download Minitab's free 30-day trial.
Simulating the NFL Bets
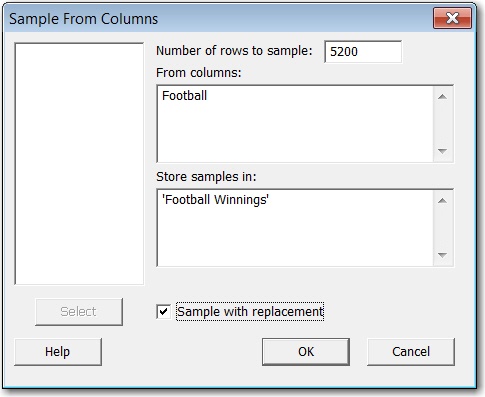
Let’s start with the football bet. We know there are two outcomes, either winning $9.09 or losing $10. So in a column called “Football,” I type “9.09” and “-10” into the first two rows. We can now take a random sample from this column because 50% of the time we'll win $9.09, and 50% of the time we'll lose $10. So let's have our 100 people make their bets! With 52 weeks in a year, and with 100 people making one bet a week, that’s a total of 5,200 total bets. To simulate that I went to Calc > Random Data > Sample From Columns and filled out the dialog as follows.
Finally, I needed a column for my 100 people! To do that, I went to Calc > Make Patterned Data > Simple Set of Numbers and filled out the dialog as follows:
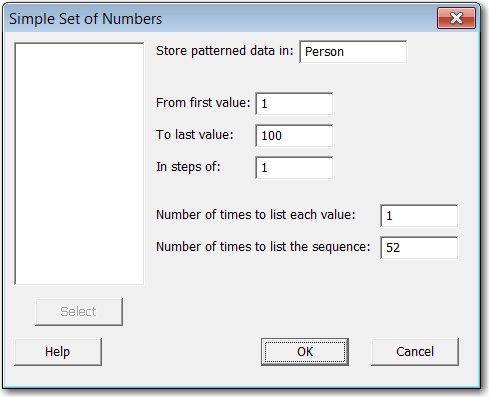
So now I have a column called "Football Winnings" that has the outcome of my 5,200 football bets, and another column called "Person" that has the numbers 1 through 100 (each number representing a different person),each listed 52 times. Voila! It's as if we had 100 people making a football bet one day for a year!
Too bad there isn't actually a football game to bet on each day of the year.
Simulating the Roulette Bets
For the roulette bets I followed the same steps as the football bets. The only difference (besides having different column names) was that the "Roulette" column had more than two observations. The odds of winning are 1 out of 38, not 1 out of 2! To make this work out, I entered 350 in the first row, and -10 in the next 37. Now when we sample from this column, we'll win $350 1/38 of the time, and lose $10 37/38 of the time.
Simulating the Lottery
The lottery simulation became much more complicated. After some math, I found that if there were 1,440,000 tickets, there would be exactly:
- 2 tickets that won $300,000
- 4 tickets that won $30,000
- 8 tickets that won $10,000
- 480 tickets that won $1000
- 960 tickets that won $500
- And so on, until you got to 1,020,919 tickets that lost $10.
In order to have a column that accurately reflects the odds of winning each prize, I need a column with 299,990 listed twice (the amount you profit), $29,990 listed 4 times, $9,999 listed 8 times, all the way to -10 listed over a million times. In total the column will have 1,440,000 rows. I’m definitely not typing all that in!
To save myself from a lot of painful data entry, I once again turned to Calc > Make Patterned Data > Simple Set of Numbers. But this time I made a column for each prize. For example, to get the 1,020,919 tickets that lost $10 I filled out the dialog as follows to get a “-10” column.
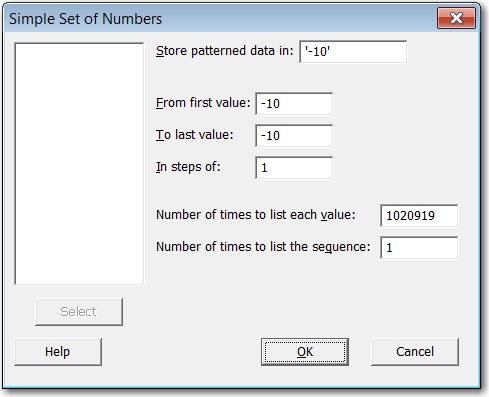
I did the same thing for each prize amount, and ended up with 10 columns (there are 12 different prize amounts, but I combined the top 3 prizes into a single column). Then I used Data > Stack > Columns to combine all the columns into a single column. But can Minitab support a single column with almost a million and a half rows? I’m about to find out.
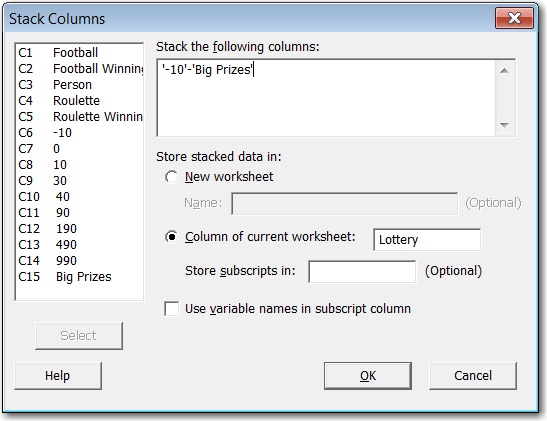
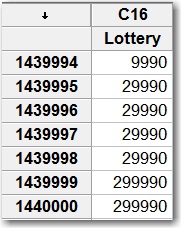
It worked! After stacking the columns, I was able to create a single “Lottery” column with 1,440,000 rows! Now I can simulate my lottery tickets just like I did with the previous two bets!
Now the hard part is behind us! We have all of our data in Minitab, so all we have to do is perform a data analysis on the results. I'm going to make one more post to show how our 300 people did. So be sure to check back tomorrow to see if anybody got lucky and won big!


