


In industry, it may be presses and CNC machines. In education, it may be computers and microscopes. In retail, it may be the forklifts in the warehouse.
Regardless of your industry or the size of your business, in all likelihood you have one or more pieces of capital equipment that must be regularly maintained. Typically these expensive pieces of equipment come with routine maintenance plans. But what happens when, perhaps after a few years of running smoothly, the equipment starts showing signs of wear? Perhaps it starts with just one small fix and all is well. Then it requires a few more unscheduled repairs in succession. Suddenly you are staring at the possibility of having to replace the entire system…and replacing the equipment was definitely not in this year’s budget!
Before this happens to you, consider using Minitab to help track these unscheduled maintenance repairs and estimate when you have to consider replacing the system. This type of analysis can be found in Minitab’s Reliability tools, using the Repairable System Analysis menu item (Stat > Reliability/Survival > Repairable System Analysis).
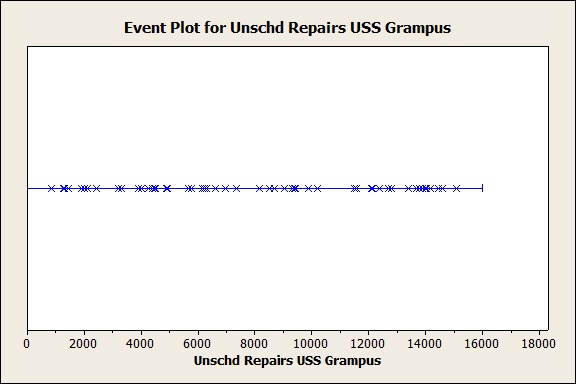
To demonstrate how we can monitor unscheduled repairs on a system, let's look at an example from Minitab’s Reliability training course. Sailors on the U.S. Navy submarine USS Grampus perform routine maintenance on its four diesel-electric engines. They want to monitor the unscheduled maintenance on the engines over time and determine whether the repair costs are increasing over time. To do this for one specific engine, the sailors record the time of failure, in hours, for each of 56 failures, and include the labor and part costs for each repair.
In the Event Plot graph of the Unscheduled Repairs below, we can see that the data points appear to be randomly scattered along the event plot line. This pattern indicates that the failure rate for the engine is constant over time. The engine is not significantly deteriorating yet.
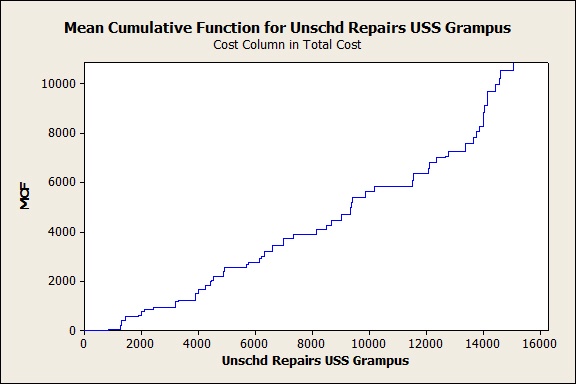
Even though the USS Grampus’ engine is not yet in full wear-out failure mode, when we evaluate the Mean Cumulative Function graph with cost, we can see that repair costs appear to increase rapidly at around 14,000 hours. The repairs for this engine are becoming more and more expensive.
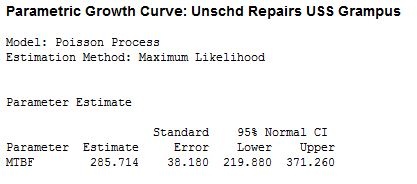
Finally, we can apply a parametric growth curve to the unscheduled maintenance time data. Because the failure rate is constant, we use the homogeneous Poisson process to get an estimate of the Mean Time Between Failures (MTBF). In this case, the MTBF for the USS Grampus’ engine is 285.714 hours. This indicates that, on average, unscheduled maintenance is required approximately every 285 hours. If, in the future, we see that interval decrease, we can assume that the engine is entering its wear-out failure mode and consider budgeting for its replacement.
Just as the engineers on the USS Grampus are able to estimate the time between each unscheduled maintenance event and identify rising costs associated with those repairs, you too can use Minitab Statistical Software to monitor repair work and prepare for the inevitable replacement of your business’s capital equipment. No crystal ball needed…just observational data and Minitab!
Already have Minitab but want to learn more about Reliability statistics? Consider attending one of Minitab’s upcoming Reliability public training sessions. Join us!
Case study:
Time-to-Market and Design for Reliability at the Speed of Light in Signify
Get ready for a light bulb moment! In a fast-changing industry where time-to-market and product reliability give a competitive edge, discover how the world’s leading lighting company Signify, rapidly validates new innovations. In this one hour webinar, Prof W.D. van Driel and Dr P. Watté will shed a light on design for reliability (DfR) using Minitab Statistical Software at Signify, the former Philips Lighting. Learn from real-life examples their methods to lower your development costs, improve your designs’ performance and compliance, and accelerate the testing of product design reliability. If you develop products intended to meet high specifications for years to come, you will discover how to reduce the risks and consequences of product failure and costly claims - for you and your customers.

![[Webinar Replay] Time-to-Market and Design for Reliability at the Speed of Light at Signify](https://no-cache.hubspot.com/cta/default/3447555/b70a5a3e-03b6-408b-bbc1-7851ef13e4e9.png)