


Over the past year I've been able to work with and learn from practitioners and experts who are using data analysis and Six Sigma to improve the quality of healthcare, both in terms of operational efficiency and better patient outcomes. I've been struck by how frequently a very basic analysis can lead to remarkable improvements, but some insights cannot be attained without conducting more sophisticated analyses. One such situation is covered in a 2011 Quality Engineering article on the application of binary logistic regression in a healthcare Six Sigma project.
In this series of blog posts, I'll follow the path of the project discussed in that article and show you how to perform the analyses described using Minitab Statistical Software. (I am using simulated data, so my analyses will not match those in the original article.)
The Six Sigma Project Goal
The goal of this Six Sigma project was to attract and retain more patients in a hospital's cardiac rehabilitation program. On being discharged, heart-surgery patients are advised to join this program, which offers psychological support and guidance on a healthy diet and lifestyle. Program participants also have two or three physical therapy sessions per week, for up to 45 sessions.
An average of 33 new patients begin participating in the program per month, and participants attend an average of 29 sessions. But many discharged patients do not enroll in the program, and many who do drop out before they complete it. Greater rates of participation would benefit individual patients' health and increase the hospital's revenues.
The project team identified two critical metrics they might improve:
- The number of patients participating in the program each month
- The number of therapy sessions for each participant
The team set a goal to increase the average number of new participants to 36 per month, and to increase the average number of sessions each patient attends to 32.
Available Patient Data
Existing data on the hospital's cardiac patients includes:
- The distance between each patient's home and the hospital
- Patient's age and gender
- Whether or not the patient has access to a car
- Whether or not the patient participated in the rehabilitation program
To illustrate the analyses conducted for this project, we will use a simulated set of data for 500 patients. Download the data set to follow along and try these analyses yourself. If you don't already have Minitab, you can download and use our statistical software free for 30 days.
Exploring Why Patients Leave the Program with a Pareto Chart
Encouraging patients who start the program to complete it, or at least to attend a greater number of sessions, has the potential to be a quick and easy "win," so the project team began by looking at why 156 patients who started the program eventually dropped out.
The reasons patients gave for dropping out of the rehabilitation program were placed into several different categories, then visualized with a Pareto chart.
The Pareto chart is a must-have in any analyst’s toolbox. The Pareto principle states that about 80% of outcomes come from 20% of the possible causes. By plotting the frequencies and corresponding percentages of a categorical variable, a Pareto chart helps identify the "vital few"—the “20%" that really matter, so you can focus your efforts where they can make the most difference.
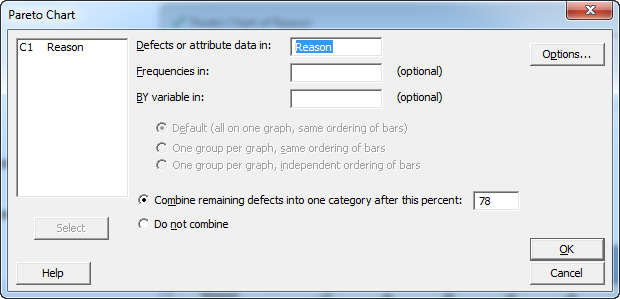
To create this chart in Minitab, open Stat > Quality Tools > Pareto Chart... From our worksheet of simulated hospital data, select the Reason column as shown:
When you press OK, Minitab creates the following chart:
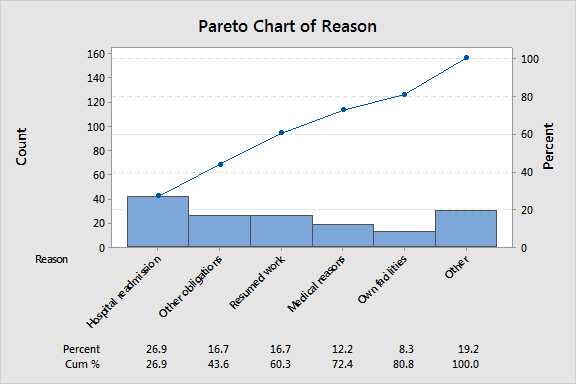
Along the x-axis, Minitab displays the reasons people dropped out of the rehabilitation program, along with the percent of the total and the cumulative percentage each reason accounted for. We can see that some 80% of these patients dropped out of the program for one of the following reasons:
- They were readmitted to the hospital.
- Work or other obligations conflicted with the program schedule.
- They could not participate for medical reasons.
- They had their own exercise facilities.
While encouraging existing participants to complete the program seemed like a good strategy, the Pareto chart shows that most people stop participating due to factors that are beyond the hospital's control. Therefore, rather than focusing on keeping existing participants, the team decided to explore how to attract more new participants.
Getting More Patients to Participate in the Program
Having decided to focus on increasing initial enrollment, the project team next gathered cardiologists, physical therapists, patients, and other stakeholders to brainstorm about the factors that influence participation.
At these brainstorming sessions, many stakeholders insisted that more people would participate in the rehabilitation program if the brochure about it were better. Another suggested solution involved sending a letter to cardiologists encouraging them to be more positive about the program and to mention it to patients at an earlier point in their treatment.
The project team recorded these suggestions, but they were wary of jumping to conclusions that weren't supported by data. They decided to look more closely at the data they had from existing patients before proceeding with any potential solutions.
In part 2, we will review how the team used graphs and basic descriptive statistics to get quick insight into the influence of individual factors on patient participation in the program.