Want to learn more about analyzing data? Try taking a page from Aesop's book.
Well...really, I'm suggesting taking multiple pages from Minitab's book, but my suggestion stems from an idea that Aesop epitomizes.
Aesop was no fool. When he wanted to convey even the heaviest of lessons, he didn't waste time detailing the intellectual and philosophical arguments behind them. He didn't argue, cajole, or berate. He didn't lecture or pontificate.
He told a story.
Minitab uses the same approach in Meet Minitab, the introductory guide to data analysis and quality statistics using our statistical software. From beginning to end, Meet Minitab follows the story of a workflow quality improvement project that takes place at a (fictional) online bookstore.
I went through the exercises in the book again recently, and was reminded of how well it illustrates the real-world applicability of data analysis.
The Hands-on Story of a Quality Improvement Project
If you're going to be responsible for analyzing data as part of a Six Sigma project, working through Meet Minitab is a good way to get hands-on experience with the types of data you're likely to be working with.
In the guide, the online book retail company you work for has three regional shipping centers that distribute orders to consumers. Each shipping center uses a different computer system to enter and process order information. To integrate all orders and use the most efficient method company wide, the company wants to use the same computer system at all three shipping centers.
As you work through the examples in the book, you analyze data from the shipping centers as you learn to use Minitab. (All of the data sets are included with Minitab, so it's easy to follow along.)
You create graphs and conduct statistical analyses to determine which computer system is the most efficient and results in the shortest delivery time.
After you identify the most efficient computer system, you focus on the data from this center. First, you
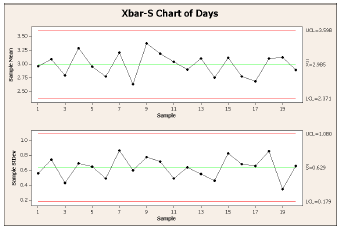
create control charts to see whether the center’s shipping process is in control. Then, you conduct a
capability analysis to see whether the process is operating within specification limits. Finally, you
conduct a designed experiment to further improve the shipping center’s processes.
Additionally, you learn about session commands, generating a report, preparing a worksheet, and customizing Minitab.
By the way, if you're more comfortable learning in a language other than English,
Meet Minitab is also available in Arabic, Simplified Chinese, Dutch, Fench, German, Japanese, Korean, Polish, Portuguese, Russian and Spanish.
An Relatable Way to Learn to Analyze Data
I always had trouble relating to the examples of dice and playing cards used so often in statistics classes. I don't gamble, so I was constantly wondering where I'd ever apply what I was learning. So when I did the exercises that make up the story of the quality project in this guide, I found the emphasis on this real-world situation refreshing and engaging.
I also really appreciated the chance to follow the project through from start to finish; unlike textbooks where each type of problem is a discrete, self-contained entity, the tasks and analyses in Meet Minitab build on and logically follow one another, so you can see why you should do certain tasks in a certain order.
Of course,
Meet Minitab is still a software user's guide. It's not
Aesop's Fables. So I can't guarantee that, after going through it, you'll recall X-bar S charts as readily as you do the story of
The Fox and the Grapes. Or that you'll understand Design of Experiments with the clarity Aesop brings to the moral of
The Tortoise and the Hare.
But after working through the book again myself, I'm confident you'll get a solid understanding of the most frequently used functions in Minitab Statistical Software, and how they can help with real-world quality improvement projects.


