


We received the following question via social media recently:
I am using Minitab for ANOVA. I calculated the mean and standard deviation for these 15 values, but the standard deviation is very high. If I delete some values, I can reduce the standard deviation. Is there an option in Minitab that will automatically indicate values that are out of range and delete them so that the standard deviation is low?
In other words, this person wanted a way to automatically eliminate certain values to lower the standard deviation.
Fortunately, Minitab Statistical Software does not have the functionality that this person was looking for.
Why is that fortunate? Because cherry-picking data isn’t a statistically sound practice. In fact, if you do it specifically to reduce variability, removing data points can amount to fraud.
When Is It OK to Remove Data Points?
So that raises a question: is it ever acceptable to remove data? The answer is yes. If you know, for a fact, that some values in your data were inappropriately attained, then it is okay to remove these bad data points. For example, if data entry errors resulted in a few data points from Sample A being entered under Sample B, it would make sense to remove those data points from the analysis of Sample B.
But you may encounter other suggestions for removing data. Some people will use a "trimmed" data set. This means you remove the top and bottom 1-2 samples. Depending upon what the data is, and how you plan to use it, this too can be fraud.
Some people will use the term "Data Cleansing." When they do this, they remove a few data points from a large data set. The end results tend to be minimal on data analysis. But when this changes the end results of an analysis, it again can amount to fraud.
The bottom line? If you don't know for certain that the data points are bad, removing them—especially to change the outcome of an analysis—is virtually impossible to defend.
Finding and Handling Outliers in Your Data
Minitab won't automatically delete values to make your standard deviation small. However, our statistical software does make it easy to identify potential outliers that may be skewing your data, so that you can investigate them. You can access the outlier detection tests at Stat > Basic Statistics > Outlier Test…
You can also look at specific statistical measures that indicate the presence of outliers in regression and ANOVA.
Of course, before removing any data points you need to make sure that the values are really outliers. First, think about whether those values were collected under the same conditions as the other values. Was there a substitute lab technician working on the day that the potential outliers were collected? If so, did this technician do something differently than the other technicians? Or could the digits in a value be reversed? That is, was 48 recorded as 84?
If you have just one factor in an ANOVA, try using Assistant > Hypothesis Tests > One-Way ANOVA… Outliers will be flagged in the output automatically:
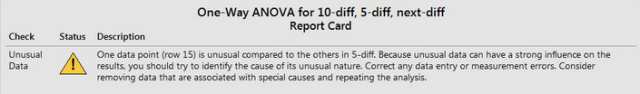
You could then run the analysis again after manually removing outliers as appropriate.
You also can use a boxplot chart to identify outliers:
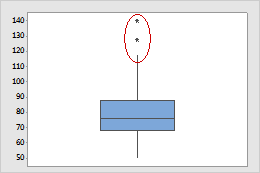
As you can see above, Minitab's boxplot uses an asterisk (*) symbol to identify outliers, defined as observations that are at least 1.5 times the interquartile range from the edge of the box. You can easily identify the unwanted data point by clicking on the outlier symbols so you can investigate further. After editing the worksheet you can update the boxplot, perhaps finding more outliers to remove.
Are Your Outliers "Keepers"?
While Minitab won't offer an automated "make my data look acceptable" tool, the software does make it easy to find specific data points that may take the results of your analysis in an inaccurate or unwanted direction.
However, before removing any "bad" data points you should understand their causes and be sure you can avoid recurrence of those causes in the actual process. If the "bad" data could contribute to a more accurate understanding of the actual process, removing them from the calculation will produce wrong results.