Like a lot of people who need to analyze data for their work, I am not an expert statistician. Over the years I've acquired a fair amount of knowledge and experience, but mainly enough to make me appreciate more than ever the value of statistical software in making data analysis an accessible tool.
And I've discovered over and over again how quickly specific statistics skills can get rusty if you haven't used them for a while.
Statistical details in any type of analysis, whether it's scientific research or a Lean Six Sigma project, can be a real challenge. Where do you turn when you’ve forgotten how to set up your data, or which test you should use to check for normality or equal variances?
One thing I really appreciate about Minitab software is how it helps me get the answers I need, when I need them -- there's a tremendous about of statistical know-how built right into the software. (And even if you're not using Minitab, resources available on our Web site can point you in the right direction when it comes to data analysis.)
How to Analyze Data Like an Expert
- Measurement Systems Analysis
- Capability Analysis
- Graphical Analysis
- Regression
- Control Charts
It even helps you interpret the results.
But that's not all. Here’s are 5 more ways Minitab can help you boost your knowledge of statistics.
1. Minitab Help
Let’s face it: the Help available in some software just isn’t that helpful. But Minitab Help is a treasure trove of truly useful information about statistics. It offers:
- Concise overviews of major statistical topics
- Guidance for setting up your data
- Information on methods and formulas
- A dynamic glossary
- Complete guidance for completing dialog boxes
- Easy-to-follow examples
2. Minitab StatGuide™
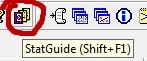
Okay, you’ve analyzed your data. But what does it mean? If I'm unsure about what the results are telling me, I check Minitab’s built-in StatGuide, which explains how to interpret statistical tables and graphs in a practical, straightforward way. From basic statistics to Design of Experiments, StatGuide offers relevant guidance when you need it most. To access the StatGuide, just right-click on your output, press Shift+F1 on the keyboard, or click the StatGuide icon in the toolbar:
3. Tutorials
Minitab’s built-in tutorials each focus on a different statistical task, giving you use cases, an overview of data requirements, step-by-step instructions, and guidance on interpreting the results. To access them, go to
Help > Tutorials in Minitab and select the subject or method you want to learn more about.
4. Minitab.com
Minitab offers a variety of free resources on our Web site, including:
5. Instructor-Led Training
When you’re looking for more in-depth learning, attend a Minitab training course—our trainers are expert statisticians with industry experience, and they designed our courses specifically for quality professionals. We also limit class size to offer you greater personal attention.
6. E-Learning
You can also learn both Minitab and statistics anytime using Quality Trainer, our e-learning course. Interactive lessons based on real-world quality improvement scenarios cover topics ranging including descriptive statistics, graphical analysis, ANOVA, correlation and regression, measurement systems analysis, design of experiments and more.
What resources do you turn to when you want to learn more about statistics and data analysis?