


You often hear the data being blamed when an analysis is not delivering the answers you wanted or expected. I was recently reminded that the data chosen or collected for a specific analysis is determined by the analyst, so there is no such thing as bad data—only bad analysis.
This made me think about the steps an analyst can take to minimise the risk of producing analysis that fails to answer answer the questions posed. Here are four tips I think are critical; we'd love to hear your thoughts and tips, too!
Tip 1: Diving Is Not Allowed
When presented with a business problem to solve, I love to dive straight into analyst mode; however, experience has taught me that to resist this temptation at all costs. Before diving in, it's vital to step back, think about the problem, and consider what type of analysis you are going to do. Broadly speaking, there are three distinct types of analysis:
- Descriptive—exploring what has happened.
The tools you might use for this type include graphical analysis, hypothesis testing, capability, and control charts.
- Predictive—forecasting what will happen next.
In this category of analysis, you use techniques such as regression, time series forecasting, and reliability analysis.
- Prescriptive—determining what should the business do next.
Techniques in this type of analysis include design of experiments, optimisation, and simulation.
Once you have determined the type of analysis you want to do, you can start trying to find existing data or collect new data to complete your analysis.
Tip 2: Reliable Data Is Key
There are three things you need to consider when collecting data for a specific type of analysis.
- How are you going to measure performance (your response variable)?
Once you have decided this, you need to ensure that this measurement can be collected accurately and precisely. If your measurements are unreliable for any reason, then your analysis and any recommendations also will be unreliable. Measurement system analysis, including gage analyses and attribute agreement analysis can help with these problems.
- What factors or input parameters might affect your performance?
These are useful in descriptive analysis for segmenting the results you are seeing, allowing you to highlight opportunities and problems is specific areas of your business. In predictive and prescriptive analysis these are essential for optimising your future business performance.
- What are the potential impacts of this analysis?
Finally, you need to understand the costs, benefits and risks associated with any analysis. This will help you determine how much you are prepared to spend on the analysis itself, and more important, what you are prepared invest to fix any problems and/or develop new opportunities the analysis reveals.
Tip 3: It’s All about the Power
Once you know what kind of analysis you need to do, then you can work out how much data you need to collect. Minitab's Power and Sample Size menu is one of the best tools for this, as it allows an analyst to calculate the sample size needed for different types of analyses, under a number of scenarios with a minimal amount of prior knowledge about the data you are going to collect.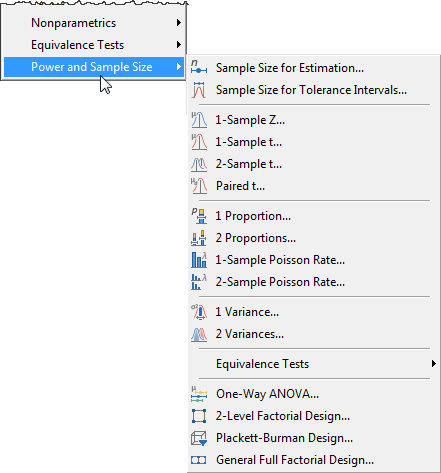
The decisions you an as analyst need to make are:
- How big is the effect you need to find?
Power is the probability of finding an effect if it exists. For example if you are making bolts that should be 10 mm in diameter on average, maybe a +/- 1 mm difference would result in too many bolts scrapped for being too big or too small. The determination of this effect (or difference) has to be done by someone with process knowledge, because it is a business, not a statistical decision. However, it is a decision that will impact the sample size.
- How much variation can you expect in your data, measured as a standard deviation?
You need to decide this because the Power calculation is proportional to the ratio of the size of the effect you are looking for. (If you don’t have a historical standard deviation, you can use the value “1” and enter the differences you are looking for as standard deviations. Typically a one-standard-deviation difference is considered small, and a three-standard-deviation difference large.)
- How powerful do you want your analyses to be?
The power is the probability of finding an effect if there is one to find, and as a minimum this should be 80%. The higher the certainty you want of finding an effect if it exists, the larger the sample you will need.
Once you have completed your power and sample size analysis, you are ready to collect your data and analyse it.
Tip 4: Good Analysis Always Has Value
When you start an analysis, you often have an idea of what you expect the results to be, because you have seen some evidence of the problem or opportunity. Consequently, when our ideas or theories are not supported by the analysis we become disappointed in the results. If you have followed a rigorous analytical methodology to answer a specific question, then accept the results, present the recommendations (in some cases this will be the recommendation of no change), and move on to the next analysis. Finding out that something is not important to your business performance can be just as important as finding out what the key influencers are!
Do you have additional suggestions for avoiding bad analyses?