


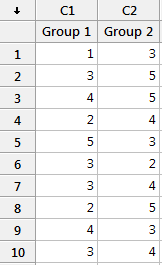
 Five-point Likert scales are commonly associated with surveys and are used in a wide variety of settings. You’ve run into the Likert scale if you’ve ever been asked whether you strongly agree, agree, neither agree or disagree, disagree, or strongly disagree about something. The worksheet to the right shows what five-point Likert data look like when you have two groups.
Because Likert item data are discrete, ordinal, and have a limited range, there’s been a longstanding dispute about the most valid way to analyze Likert data. The basic choice is between a parametric test and a nonparametric test. The pros and cons for each type of test are generally described as the following:
- Parametric tests, such as the 2-sample t-test, assume a normal, continuous distribution. However, with a sufficient sample size, t-tests are robust to departures from normality.
- Nonparametric tests, such as the Mann-Whitney test, do not assume a normal or a continuous distribution. However, there are concerns about a lower ability to detect a difference when one truly exists.
What’s the better choice? This is a real-world decision that users of statistical software have to make when they want to analyze Likert data.
Over the years, a number of studies that have tried to answer this question. However, they’ve tended to look at a limited number of potential distributions for the Likert data, which causes the generalizability of the results to suffer. Thanks to increases in computing power, simulation studies can now thoroughly assess a wide range of distributions.
In this blog post, I highlight a simulation study conducted by de Winter and Dodou* that compares the capabilities of the two sample t-test and the Mann-Whitney test to analyze five-point Likert items for two groups. Is it better to use one analysis or the other?
The researchers identified a diverse set of 14 distributions that are representative of actual Likert data. The computer program drew independent pairs of samples to test all possible combinations of the 14 distributions. All in all, 10,000 random samples were generated for each of the 98 distribution combinations! The pairs of samples are analyzed using both the two sample t-test and the Mann-Whitney test to compare how well each test performs. The study also assessed different sample sizes.
The results show that for all pairs of distributions the Type I (false positive) error rates are very close to the target amounts. In other words, if you use either analysis and your results are statistically significant, you don’t need to be overly concerned about a false positive.
The results also show that for most pairs of distributions, the difference between the statistical power of the two tests is trivial. In other words, if a difference truly exists at the population level, either analysis is equally likely to detect it. The concerns about the Mann-Whitney test having less power in this context appear to be unfounded.
I do have one caveat. There are a few pairs of specific distributions where there is a power difference between the two tests. If you perform both tests on the same data and they disagree (one is significant and the other is not), you can look at a table in the article to help you determine whether a difference in statistical power might be an issue. This power difference affects only a small minority of the cases.
Generally speaking, the choice between the two analyses is tie. If you need to compare two groups of five-point Likert data, it usually doesn’t matter which analysis you use. Both tests almost always provide the same protection against false negatives and always provide the same protection against false positives. These patterns hold true for sample sizes of 10, 30, and 200 per group.
*de Winter, J.C.F. and D. Dodou (2010), Five-Point Likert Items: t test versus Mann-Whitney-Wilcoxon, Practical Assessment, Research and Evaluation, 15(11).