


The constant term in linear regression analysis seems to be such a simple thing. Also known as the y intercept, it is simply the value at which the fitted line crosses the y-axis.
While the concept is simple, I’ve seen a lot of confusion about interpreting the constant. That’s not surprising because the value of the constant term is almost always meaningless!
Paradoxically, while the value is generally meaningless, it is crucial to include the constant term in most regression models!
In this post, I’ll show you everything you need to know about the constant in linear regression analysis.
I'll use fitted line plots to illustrate the concepts because it really brings the math to life. However, a 2D fitted line plot can only display the results from simple regression, which has one predictor variable and the response. The concepts hold true for multiple linear regression, but I can’t graph the higher dimensions that are required.
Zero Settings for All of the Predictor Variables Is Often Impossible
I’ve often seen the constant described as the mean response value when all predictor variables are set to zero. Mathematically, that’s correct. However, a zero setting for all predictors in a model is often an impossible/nonsensical combination, as it is in the following example.
In my last post about the interpretation of regression p-values and coefficients, I used a fitted line plot to illustrate a weight-by-height regression analysis. Below, I’ve changed the scale of the y-axis on that fitted line plot, but the regression results are the same as before.
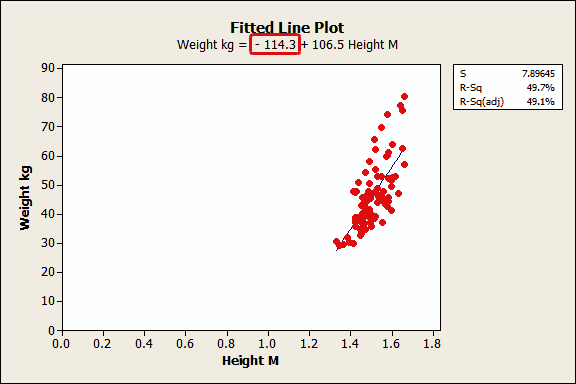
If you follow the blue fitted line down to where it intercepts the y-axis, it is a fairly negative value. From the regression equation, we see that the intercept value is -114.3. If height is zero, the regression equation predicts that weight is -114.3 kilograms!
Clearly this constant is meaningless and you shouldn’t even try to give it meaning. No human can have zero height or a negative weight!
Now imagine a multiple regression analysis with many predictors. It becomes even more unlikely that ALL of the predictors can realistically be set to zero.
If all of the predictors can’t be zero, it is impossible to interpret the value of the constant. Don't even try!
Zero Settings for All of the Predictor Variables Can Be Outside the Data Range
Even if it’s possible for all of the predictor variables to equal zero, that data point might be outside the range of the observed data.
You should never use a regression model to make a prediction for a point that is outside the range of your data because the relationship between the variables might change. The value of the constant is a prediction for the response value when all predictors equal zero. If you didn't collect data in this all-zero range, you can't trust the value of the constant.
The height-by-weight example illustrates this concept. These data are from middle school girls and we can’t estimate the relationship between the variables outside of the observed weight and height range. However, we can get a sense that the relationship changes by marking the average weight and height for a newborn baby on the graph. That’s not quite zero height, but it's as close as we can get.
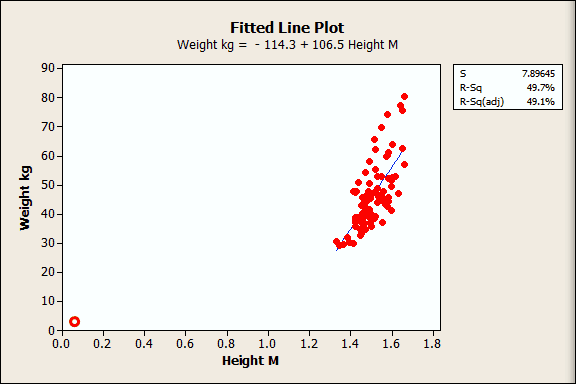
I drew the red circle near the origin to approximate the newborn's average height and weight. You can clearly see that the relationship must change as you extend the data range!
So the relationship we see for the observed data is locally linear, but it changes beyond that. That’s why you shouldn’t predict outside the range of your data...and another reason why the regression constant can be meaningless.
The Constant Is the Garbage Collector for the Regression Model
Even if a zero setting for all predictors is a plausible scenario, and even if you collect data within that all-zero range, the constant might still be meaningless!
The constant term is in part estimated by the omission of predictors from a regression analysis. In essence, it serves as a garbage bin for any bias that is not accounted for by the terms in the model. You can picture this by imagining that the regression line floats up and down (by adjusting the constant) to a point where the mean of the residuals is zero, which is a key assumption for residual analysis. This floating is not based on what makes sense for the constant, but rather what works mathematically to produce that zero mean.
The constant guarantees that the residuals don’t have an overall positive or negative bias, but also makes it harder to interpret the value of the constant because it absorbs the bias.
Why Is it Crucial to Include the Constant in a Regression Model?
Immediately above, we saw a key reason why you should include the constant in your regression model. It guarantees that your residuals have a mean of zero.
Additionally, if you don’t include the constant, the regression line is forced to go through the origin. This means that all of the predictors and the response variable must equal zero at that point. If your fitted line doesn’t naturally go through the origin, your regression coefficients and predictions will be biased if don't include the constant.
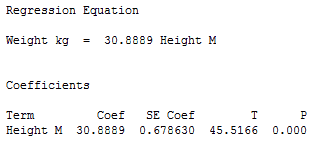
I’ll use the height and weight regression example to illustrate this concept. First, I’ll use General Regression in Minitab statistical software to fit the model without the constant. In the output below, you can see that there is no constant, just a coefficient for height.
Next, I’ll overlay the line for this equation on the previous fitted line plot so we can compare the model with and without the constant.
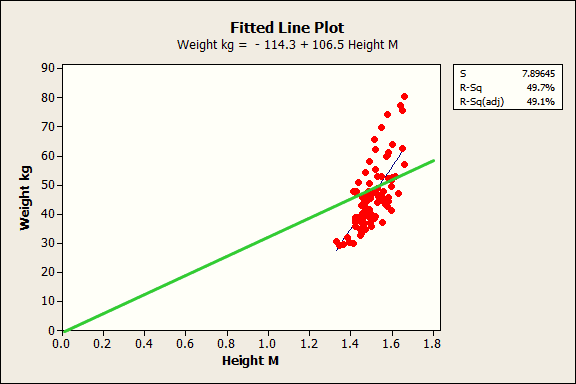
The blue line is the fitted line for the regression model with the constant while the green line is for the model without the constant. Clearly, the green line just doesn’t fit. The slope is way off and the predicted values are biased. For the model without the constant, the weight predictions tend to be too high for shorter subjects and too low for taller subjects.
In closing, the regression constant is generally not worth interpreting. Despite this, it is almost always a good idea to include the constant in your regression analysis. In the end, the real value of a regression model is the ability to understand how the response variable changes when you change the values of the predictor variables. Don't worry too much about the constant!
If you're learning about regression, read my regression tutorial!