There may be huge potential benefits waiting in the data in your servers. These data may be used for many different purposes. Better data allows better decisions, of course. Banks, insurance firms, and telecom companies already own a large amount of data about their customers. These resources are useful for building a more personal relationship with each customer.
Some organizations already use data from agricultural fields to build complex and customized models based on a very extensive number of input variables (soil characteristics, weather, plant types, etc.) in order to improve crop yields. Airline companies and large hotel chains use dynamic pricing models to improve their yield management. Data is increasingly being referred as the new “gold mine” of the 21st century.
A couple of factors underlie the rising prominence of data (and, therefore, data analysis):
Huge volumes of data
Data acquisition has never been easier (sensors in manufacturing plants, sensors in connected objects, data from internet usage and web clicks, from credit cards, fidelity cards, Customer Relations Management databases, satellite images etc…) and it can easily be stored at costs that are lower than ever before (huge storage capacity now available on the cloud and elsewhere). The amount of data that is being collected is not only huge, it is growing very fast… in an exponential way.
Unprecedented velocity
Connected devices, like our smart phones, provide data in almost real time and it can be processed very quickly. It is now possible to react to any change…almost immediately.
Incredible variety
The data collected is not be restricted to billing information; every source of data is potentially valuable for a business. Not only is numeric data getting collected in a massive way, but also unstructured data such as videos, pictures, etc., in a large variety of situations.
But the explosion of data available to us is prompting every business to wrestle with an extremely complicated problem:
How can we create value from these resources ?
Very simple methods, such as counting words used in queries submitted to company web sites, do provide a good insight as to the general mood of your customers and its evolution. Simple statistical correlations are often used by web vendors to suggest a purchase just after buying a product on the web. Very simple descriptive statistics are also useful.
Just guess what could be achieved from advanced regression models or powerful statistical multivariate techniques, which can be applied easily with statistical software packages like Minitab.
A simple example of the benefits of analyzing an enormous database
Let's consider an example of how one company benefited from analyzing a very large database.
Many steps are needed (security and safety checks, cleaning the cabin, etc.) before a plane can depart. Since delays negatively impact customer perceptions and also affect productivity, airline companies routinely collect a very large amount of data related to flight delays and times required to perform tasks before departure. Some times are automatically collected, others are manually recorded.
A major worldwide airline company intended to use this data to identify the crucial milestones among a very large number of preparation steps, and which ones often triggered delays in departure times. The company used Minitab's stepwise regression analysis to quickly focus on the few variables that played a major role among a large number of potential inputs. Many variables turned out to be statistically significant, but two among them clearly seemed to make a major contribution (X6 and X10).
Analysis of Variance1
Source DF Seq SS Contribution Adj SS Adj MS F-Value P-Value
X6 1 337394 53.54% 2512 2512.2 29.21 0.000
X10 1 112911 17.92% 66357 66357.1 771.46 0.000
When huge databases are used, statistical analyses may become overly sensitive and detect even very small differences (due to the large sample and power of the analysis). P values often tend to be quite small (p < 0.05) for a large number of predictors.
However, in Minitab, if you click on Results in the regression dialogue box and select Expanded tables, contributions from each variable will get displayed. X6 and X10 when considered together were contributing to more than 80% of the overall variability (with the largest F values by far), the contributions from the remaining factors were much smaller. The airline then ran a residual analysis to cross-validate the final model.
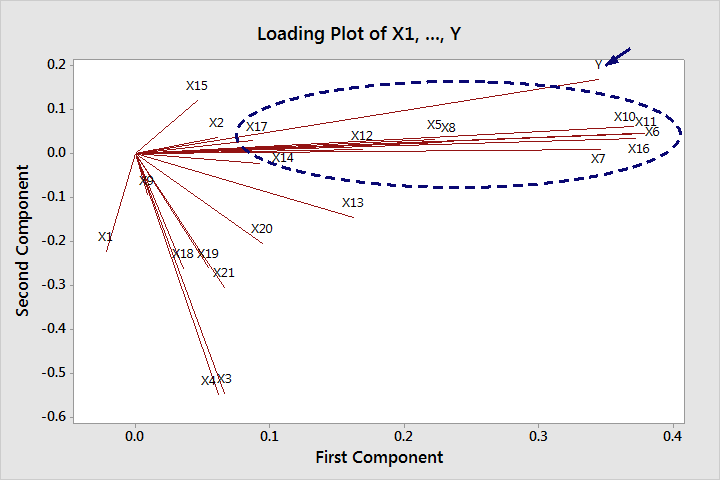
In addition, a Principal Component Analysis (PCA, a multivariate technique) was performed in Minitab to describe the relations between the most important predictors and the response. Milestones were expected to be strongly correlated to the subsequent steps.

The graph above is a Loading Plot from a principal component analysis. Lines that go in the same direction and are close to one another indicate how the variables may be grouped. Variables are visually grouped together according to their statistical correlations and how closely they are related.
A group of nine variables turned out to be strongly correlated to the most important inputs (X6 and X10) and to the final delay times (Y). Delays at the X6 stage obviously affected the X7 and X8 stages (subsequent operations), and delays from X10 affected the subsequent X11 and X12 operations.
Conclusion
This analysis provided simple rules that this airline's crews can follow in order to avoid delays, making passengers' next flight more pleasant.
The airline can repeat this analysis periodically to search for the next most important causes of delays. Such an approach can propel innovation and help organizations replace traditional and intuitive decision-making methods with data-driven ones.
What's more, the use of data to make things better is not restricted to the corporate world. More and more public administrations and non-governmental organizations are making large, open databases easily accessible to communities and to virtually anyone.


