


No one could argue steel is not strong and reliable. It is a go-to material for crafting a long-lasting and durable product. But when your product is made of such strong material, you are going to need even stronger tools to make the product itself, not to mention a strong grasp on your data and the insights your data can provide on when machines will need to be repaired or replaced.
Let's consider a forging company — we'll call them Silver Dam International — where Bill, a process engineer, is studying the performance of a forging die and fixture in order to both...
- increase the quality of the crank shaft it forges; and
- reduce costs for their customers
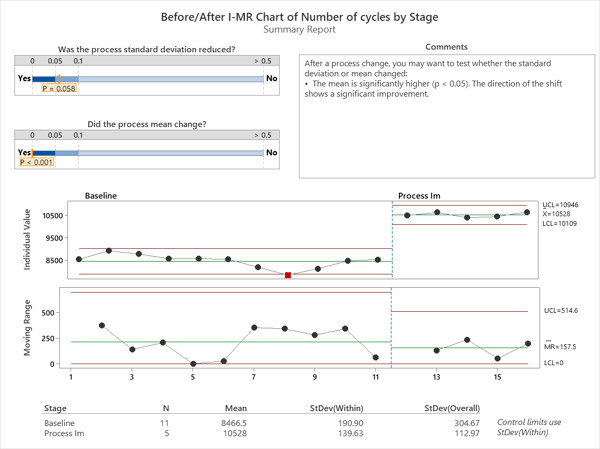
Determining the Baseline with a Control Chart
To begin, Bill has his team plot the average number of cycles in a control chart in Minitab to determine a baseline:
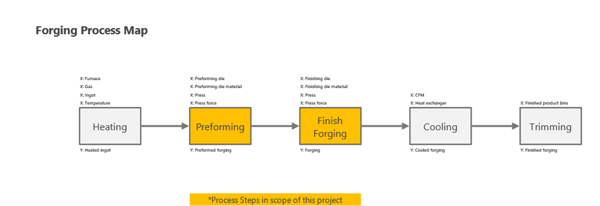
Mapping the Process
Once the baseline is established, they can create a process map in Minitab Workspace to identify main process steps, inputs and outputs that illuminate opportunities for improvement.
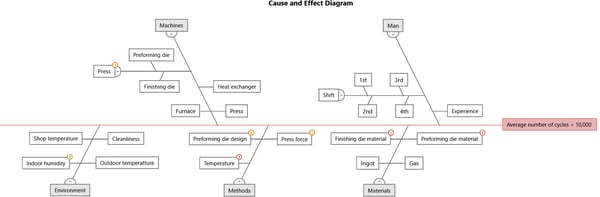
Brainstorming Cause and Effect
Then, the team can make a simple Cause and Effect Diagram (also known as Fishbone) to brainstorm potential causes of error:
Finally, an FMEA and Control Plan to Help Chart the Path to Improvements
Bill and the team complete a Failure Mode and Effects Analysis (FMEA) in Workspace to assess risk and identify mitigation opportunities. They already documented specification limits, inspection frequency and contingency plans in a Control Plan to ensure the improvements to the process last.
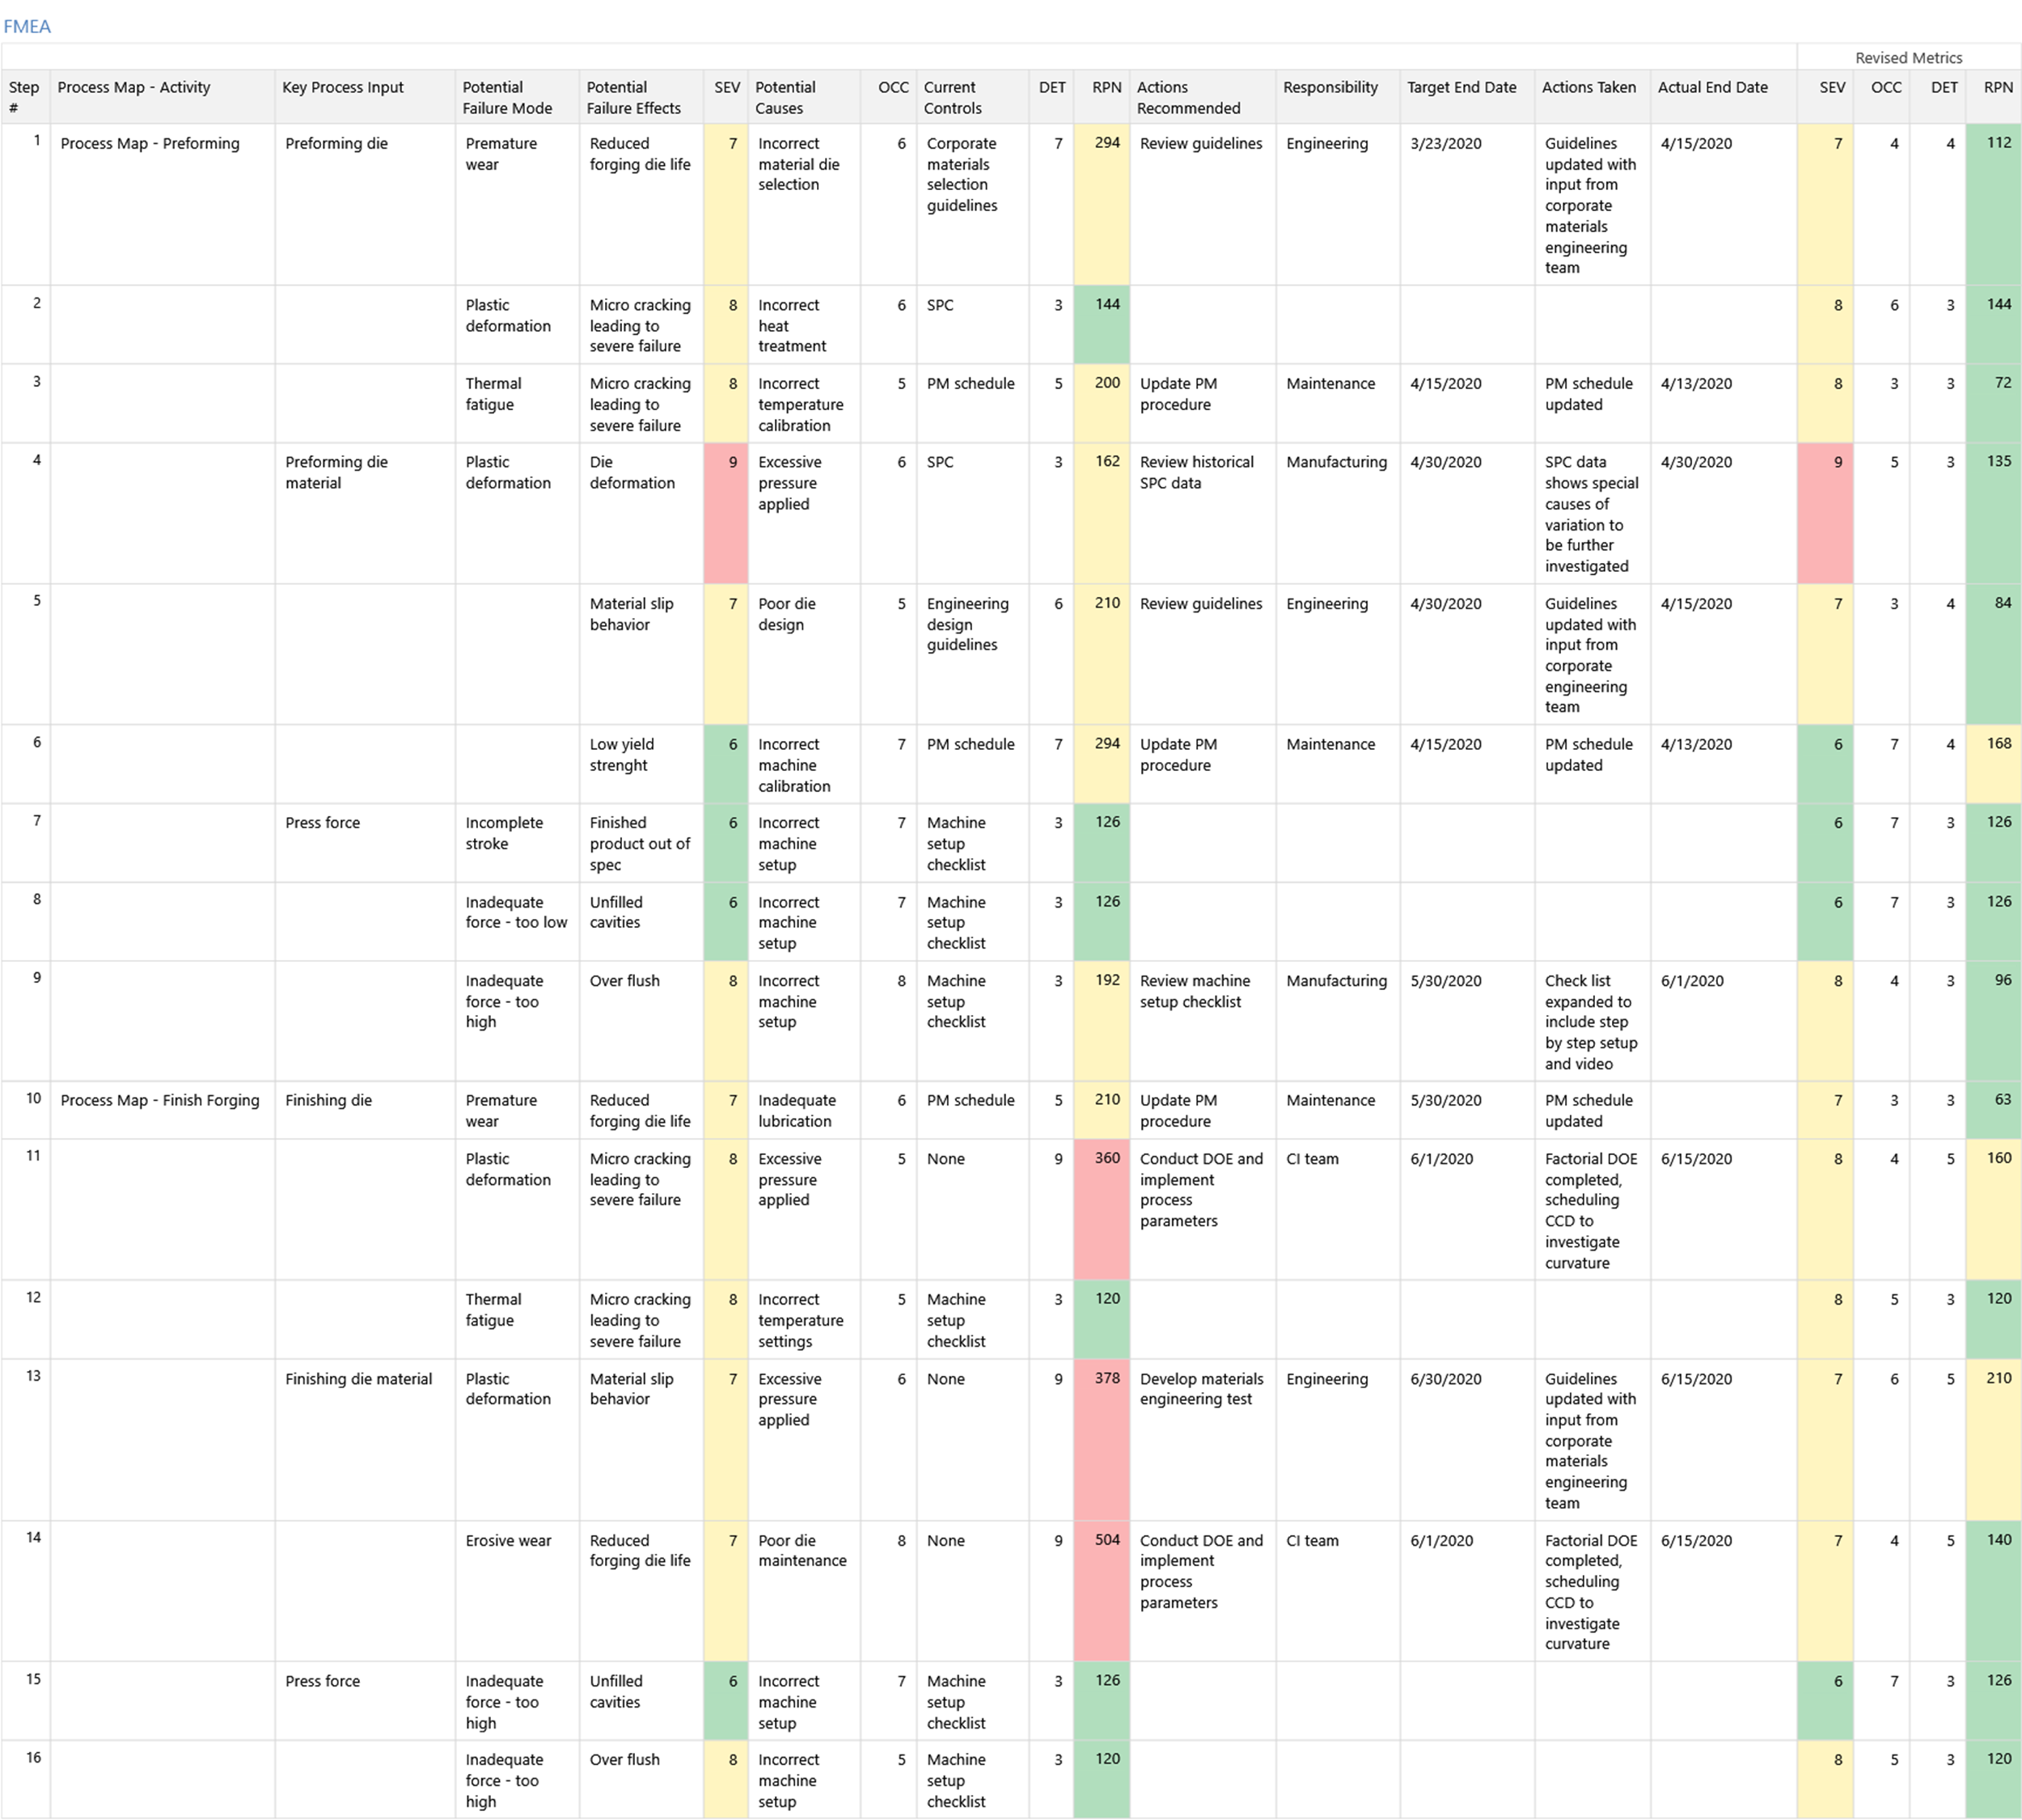
(click to expand)
Visualizing It All
The forging die is the tool that needs to be strong enough for the metal to be forced into its shape without deforming or shattering, but you need different kinds of tools and strength when making a comprehensive evaluation of a process with so many variables: your data analysis and project software.
Bill and the team at Silver Dam International used a variety of problem-solving tools to comprehensively visualize critical factors that affect the forging process. The team discovers the baseline metrics and opportunities to improve the process with the data they collected and analyzed in Minitab, which they can easily right-click and import into Minitab Workspace. From there they visualize the process in a process map, brainstorm cause and effect with a Fishbone diagram and overall plan for how to eliminate waste and address the most critical process inputs with their FMEA and Control Plan documents.
It’s helpful to work with a set of tools that complement each other and have a common purpose to help you achieve your vision of success!
Try Both Minitab Statistical Software and Minitab Workspace Free


Thanks to Minitab Solutions Architect Antonio Vargas for the research and technical support on this use case!