While many Six Sigma practitioners and other quality improvement professionals like to use the Fishbone diagram in Engage for brainstorming because of its ease of use and integration with other Minitab Engage tools, some Minitab users find an infrequent need for a Fishbone diagram. For the more casual user of the Fishbone diagram, Minitab has the right tool to get the job done.
Minitab’s Fishbone (or Cause-and-Effect) diagram can be accessed from the Quality Tools menu:

There are two ways to complete the dialog box and create a Fishbone diagram in Minitab:
-
By typing the information directly into the Cause-and-Effect dialog window, or
-
By entering the information in the worksheet first and then using the worksheet data to complete the Cause-and-Effect dialog box.
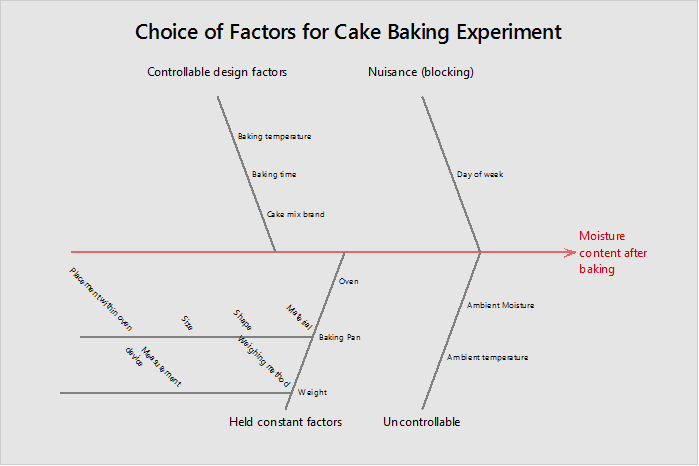
In this post, I’ll walk through examples of how to create a Fishbone diagram using both options, starting with the first option above. Because I’m a baking aficionado, I’ll be using an example related to brainstorming the choice of factors in a cake-baking experiment (where the response is the moisture after baking the cake).
Creating a Fishbone Diagram by Typing Information into the Dialog
First, we’ll start by using the drop-down lists on the left side to tell Minitab that our information is in Constants (meaning we will type the information into this dialog box, versus having the data already typed into the worksheet).
For this example, I’ll have four branches in the Fishbone, so I’ve selected Constants next to Branch 1, 2, 3 and 4 below, and then I’ve typed the name of each branch on the right side, under Label:

As we work through this, we can always click OK to see our progress. So far we have:

To go back to the last dialog to keep entering information, press Ctrl+E on the keyboard.
Next, I’ve entered the causes in the empty column in the middle. Note that any individual cause that includes multiple words (for example, Day of Week) must be included in double-quotes: “Day of Week.” Without the double-quotes, Minitab will assign each individual word as a cause. Multiple causes for the same branch are entered with a space between the causes. For example, to enter Ambient Temperature and Ambient Moisture as causes, I’ll enter:
“Ambient Temperature” “Ambient Moisture”
After completing the dialog like in the example below, we can click OK again to see our progress:

Now I’ve used Ctrl+E on my keyboard again to return to the dialog box. As a final step, I’m going to add sub-branches to some of my causes. For this example, two of the causes in the ‘Held constant factors’ branch have sub-branches. To add my sub-branches, I’ll click the Sub… button below for that particular branch:

This will bring up the Sub-Branches dialog. Here the names of each of my causes are automatically listed in the Labels column. All I need to do is (1) choose Constants from the drop-down list and (2) type in the sub-branch labels. Note that the same double-quote rule for sub-braches with multiple words applies here:

After completing the dialog above and clicking OK in each window, we can see our final graph:

Creating a Fishbone Diagram by Using Data Entered in the Worksheet
As a first step, I”ll type in my branch labels, effect, and title for my fishbone diagram:

Now I’ll click OK to see my progress and go to the worksheet to type in my data like in the example below:

Notice that here we don’t need to include double-quotes for any causes or sub-branches that are described with multiple words. Also, note that the branch titles are still typed into the dialog (so the column titles in the columns above are just for my own reference, because Minitab does not use these column titles).
After entering the data in the worksheet, I can use Ctrl + E to go back to the dialog box. This time I’ll leave the default option for the Causes (‘In column’) and I’ll select the columns I want to use for each cause:

Now I can click OK in each dialog box to show the fishbone diagram, which looks just like the one we generated using the first method: