


In technical support, we often receive questions about Gage R&R and how Minitab calculates the amount of variation that is attributable to the various sources in a measurement system.
This post will focus on how the variance components are calculated for a crossed Gage R&R using the ANOVA table, and how we can obtain the %Contribution, StdDev, Study Var and %Study Var shown in the Gage R&R output. For this example, we will accept all of Minitab’s default values for the calculations.
The sample data used in this post is available within Minitab by navigating to File > Open Worksheet, and then clicking the Look in Minitab Sample Data folder button at the bottom of the dialog box. (If you're not already using Minitab, get the free 30-day trial.) The name of the sample data set is Gageaiag.MTW. For this data set, 10 parts were selected that represent the expected range of the process variation. Three operators measured the 10 parts, three times per part, in a random order.
To see the Gage R&R ANOVA tables in Minitab, we use Stat > Quality Tools > Gage Study > Gage R&R Study (Crossed), and then complete the dialog box as shown below:
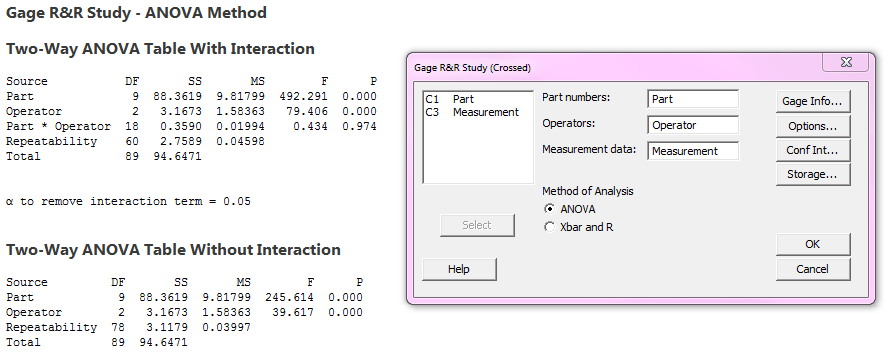
Minitab’s default alpha to remove the Part*Operator interaction is 0.05. Since the p-value for the interaction in the first ANOVA table is 0.974 (much greater than 0.05), Minitab removes the interaction and shows a second ANOVA table with no interaction.
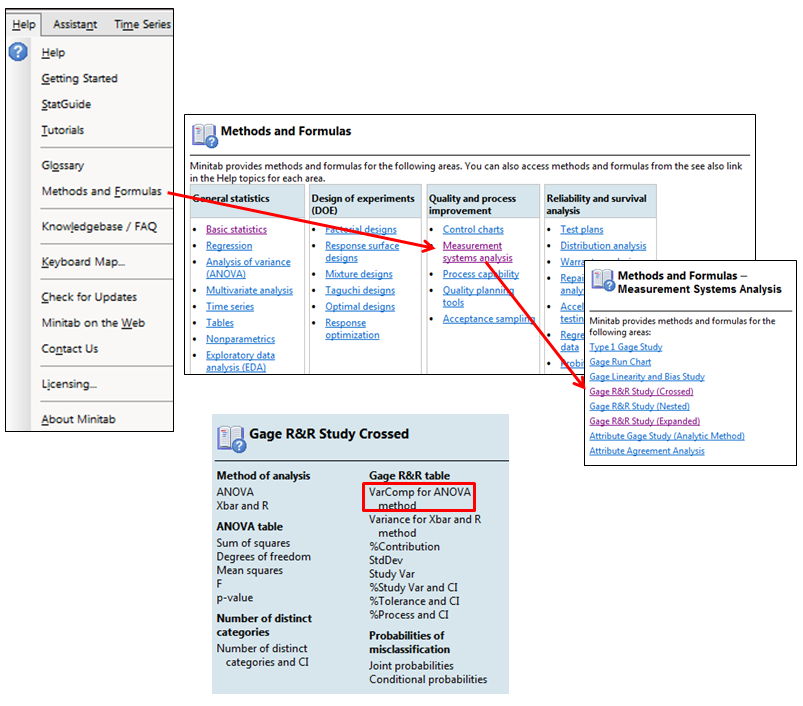
To calculate the Variance Components, we turn to Minitab’s Methods and Formulas section: Help > Methods and Formulas > Measurement systems analysis > Gage R&R Study (Crossed), and then choose VarComp for ANOVA method under Gage R&R table.
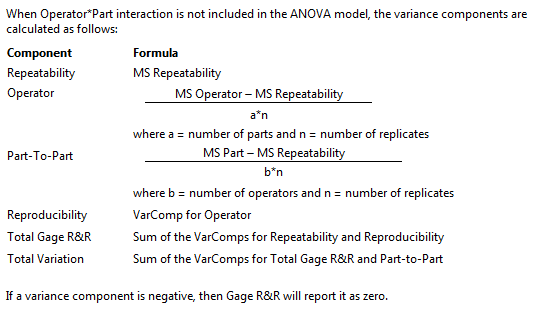
There are two parts to this section of Methods and formulas. The first provides the formulas used when the Operator*Part interaction is part of the model. In this example, the Operator*Part interaction was not significant and was removed. Therefore we use the formulas for the reduced model:
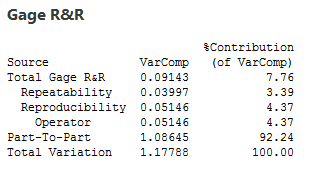
The variance components section of the crossed Gage R&R output is shown below so we can compare our hand calculations to Minitab’s results:
We will do the hand calculations using the reduced ANOVA table for each source of variation:
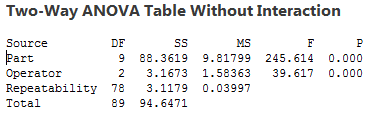
Repeatability is estimated as the Mean Square (MS column) for Repeatability in the ANOVA table, so the estimate for Repeatability is 0.03997.
We can see the formula for Operator above. The number of replicates is the number of times each operator measured each part. We had 10 parts in this study, and each operator measured each of the 10 parts 3 times, so the denominator for the Operator calculation is 10*3. The numerator is the MS Operator – MS repeatability, so the formula for the variance component for the Operator is (1.58363-0.03997)/(10*3) = 1.54366/30 = 0.0514553.
Next, Methods and Formulas shows how to calculate the Part-to-Part variation. The b represents the number of operators (in this study we had 3), and n represents the number of replicates (that is also 3 since each operator measured each part 3 times). So the denominator for the Part-to-Part variation is 3*3, and the numerator is MS Part – MS Repeatability. Therefore, the Part-to-Part variation is (9.81799-0.03997)/(3*3) = 1.08645.
Reproducibility is easy since it is the same as the variance component for operator that we previously calculated; 0.0514553.
For the last two calculations, we’re just adding the variance components for the sources that we previously calculated:
Total Gage R&R = Repeatability + Reproducibility = 0.03997 + 0.0514553 = 0.0914253.
Total Variation = Total Gage R&R + Part-to-Part = 0.0914253 + 1.08645 = 1.17788.
Notice that the Total Variation is the sum of all the variance components. The variances are additive so the total is just the sum of the other sources.
The %Contribution of VarComp column is calculated using the variance components- the VarComp for each source is divided by Total Variation:
| Source |
VarComp |
Calculation |
%Contribution |
| Total Gage R&R |
0.0914253 |
0.0914253/1.17788*100 |
7.76185 |
| Repeatability |
0.03997 |
0.03997/1.17788*100 |
3.39338 |
| Reproducibility |
0.0514553 |
0.0514553/1.17788*100 |
4.36847 |
| Operator |
0.0514553 |
0.0514553/1.17788*100 |
4.36847 |
| Part-To-Part |
1.08645 |
1.08645/1.17788*100 |
92.2377 |
| Total variation |
1.17788 |
1.17788/1.17788*100 |
100 |
Now that we’ve replicated the Variance components output, we can use these values to re-create the last table in Minitab’s Gage R&R output:
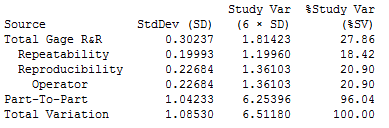
The StdDev column is simple- there we’re just taking the square root of each of the values in the VarComp column. To Total Variation value in the StDev column is the square root of the corresponding VarComp column (it is not the sum of the standard deviations):
| Source |
VarComp |
Square Root of VarComp = StdDev |
6 x StdDev = Study Var |
| Total Gage R&R |
0.0914253 |
0.302366 |
1.81420 |
| Repeatability |
0.03997 |
0.199925 |
1.19955 |
| Reproducibility |
0.0514553 |
0.226838 |
1.36103 |
| Operator |
0.0514553 |
0.226838 |
1.36103 |
| Part-To-Part |
1.08645 |
1.04233 |
6.25397 |
| Total Variation |
1.17788 |
1.08530 |
6.51181 |
Finally, the %Study Var column is calculated by dividing the Study Var for each source by the Study Var value in the Total Variation row. For example, the %Study Var for Repeatability is 1.19955/6.51181*100 = 18.4211%.
I hope this post helps you understand where these numbers come from in a Gage R&R. Let’s just be glad that we have Minitab to do the calculations behind the scenes so we don’t have to do this by hand every time!