


Minitab's capability analysis output gives you estimates of the capability indices Ppk and Cpk, and we receive many questions about the difference between them. Some of my colleagues have taken other approaches to explain the difference between Ppk and Cpk, so I wanted to show you how they differ by detailing precisely how each one is calculated.
When you're using statistical software like Minitab, you don't need to do these calculations by hand, but I also want to lift the lid off the "black box" to show you what Minitab does behind the scenes to provide these figures.
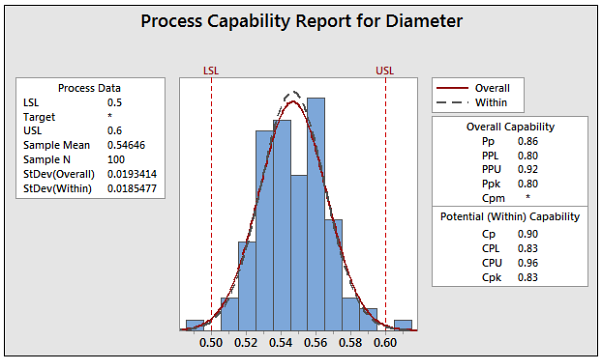
In my previous post, we saw how Ppk is calculated. This time, we'll go through the calculation of Cpk, using the same sample data set in Minitab. Go to File > Open Worksheet, click the "Look in Minitab Sample Data folder" button at the bottom, and open the dataset named CABLE.MTW.
Calculating Within-Subgroup Standard Deviation
Where Ppk uses the overall standard deviation, Cpk uses the within-subgroup standard deviation. Calculating Cpk is easy once we have an estimate of the within-subgroup standard deviation. The default method in Minitab for the within-subgroup calculation is the pooled standard deviation. The formula for this calculation from Methods and formulas is:
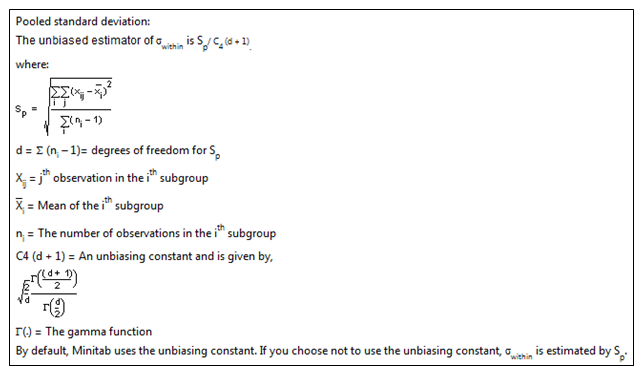
This looks a little intimidating, but you’ll see it’s not so bad if we take it one step at a time.
First, we’ll calculate Sp. For this example, the subgroup size is fixed at 5. We’ll begin with a clean worksheet containing only the Diameter data in C1.
We need to estimate the mean of the data in each subgroup and store those values in the worksheet. To do that, we’ll create a column that defines our subgroups using Calc > Make Patterned Data > Simple Set of Numbers, and then completing the dialog box as shown below:
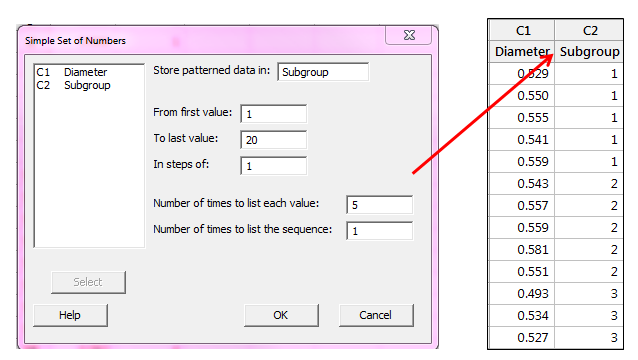
With 100 data points and 5 points in each subgroup, we have 20 subgroups.
Now we can use our new column containing the subgroups to calculate the mean of each subgroup, using Stat > Basic Statistics > Store Descriptive Statistics. We complete the dialog box like in the example below, entering the Diameter column under Variables and the Subgroup column as the By variable:
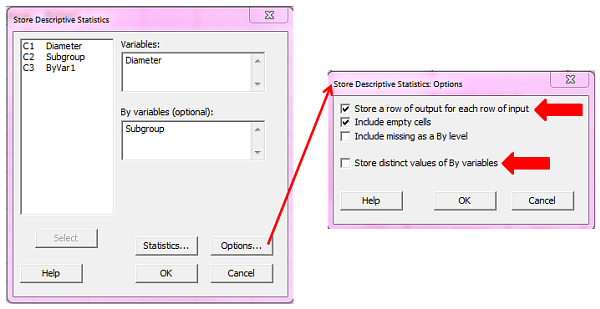
We then click Options and choose Store a row of output for each row of input, uncheck Store district values of By variables, and then click OK in each dialog box. Now column C3 will show the average of each subgroup; the first 5 rows from C1 were used to calculate the mean of those first 5 rows, and that same mean value is displayed in the first 5 rows of C3.
We will now use these values to calculate the numerator for Sp using Calc > Calculator:
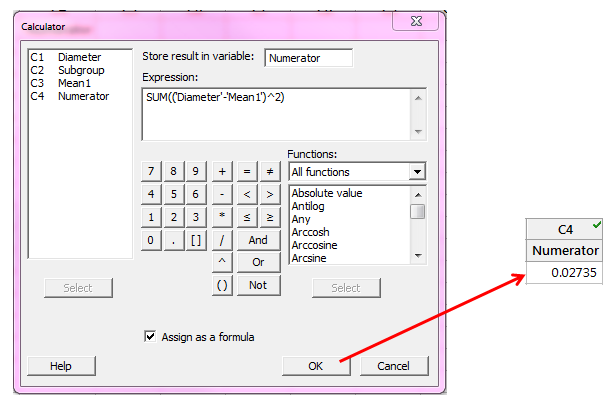
We are summing the squared differences between each measurement and its subgroup mean. The Numerator column in the Minitab worksheet will show 0.02735 using the formula above.
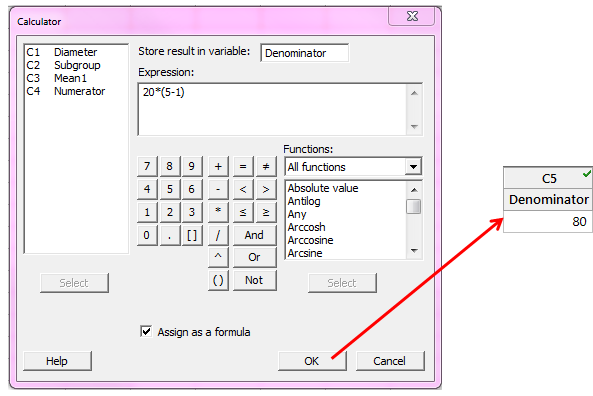
Next, we calculate the denominator for Sp, which is the subgroup size minus 1, summed over all subgroups. Since we have a constant subgroup size of 5, and a total of 20 subgroups, an easy way to enter this in the calculator is:
Now with the numerator and denominator for Sp stored in the worksheet, we take the square root of Numerator/Denominator:
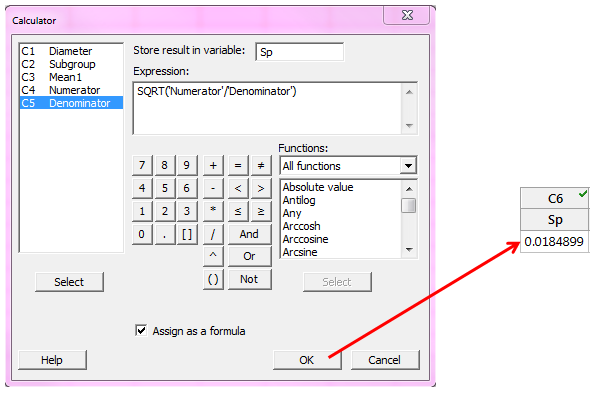
Notice that the Sp value 0.0184899 is the estimate of the subgroup standard deviation if we tell Minitab NOT to use the unbiasing constant, C4, by clicking the Estimate button in the Normal Capability Analysis dialog box and then unchecking Use unbiasing constants.
Now to finish calculating the within-subgroup standard deviation using C4 (the default), we can look up C4 in the table that is linked in Methods and Formulas under the Methods heading.
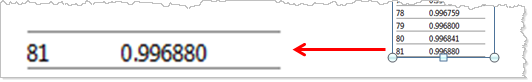
The C4 value we need is C4 for (d + 1). As defined in Methods and formulas, d is the sum of (subgroup size – 1); in our case the subgroup size is fixed at 5, so 20*(5-1) = 80. If d = 80, we add 1 and get 81, so we look up N = 81 in the C4 column of unbiasing constants:
We enter 0.996880 in column C7 in the worksheet and use it in the calculator to get the pooled within-subgroup standard deviation:
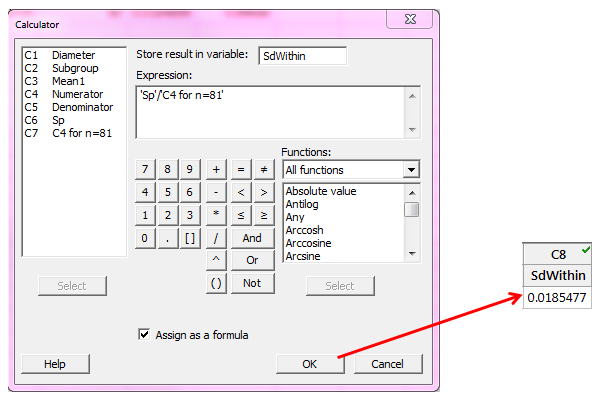
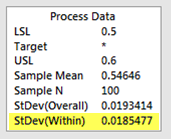
We can see that this value matches the output from our initial capability analysis graph.
Calculating Cpk
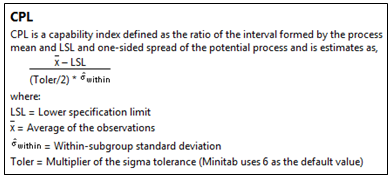
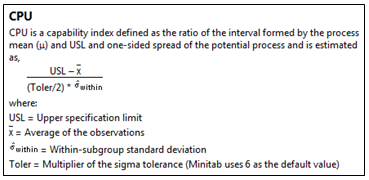
Finally, we use our within-subgroup standard deviation to calculate CPU and CPL. Cpk is the lesser of CPU and CPL, and we find these two formulas in Methods and Formulas:
We calculate CPL and CPU as shown below using the calculator and the mean of the data that we previously calculated:
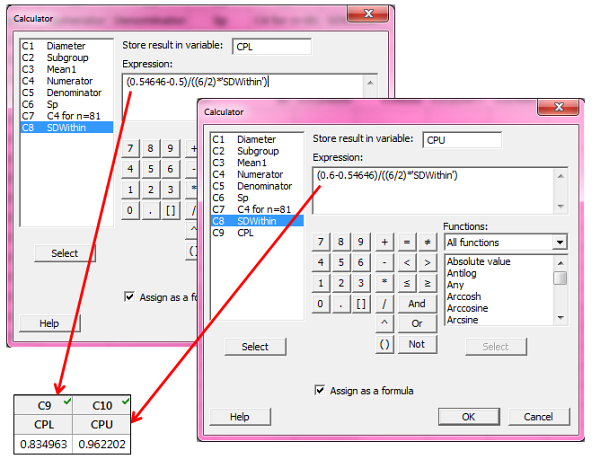
Since Cpk is the lesser of the two resulting values, Cpk is 0.83. That matches the Cpk value in Minitab’s capability output:
As long as you're using Minitab, you won't need to calculate Ppk and Cpk by hand. But I hope seeing the calculations Minitab uses to get these capability indices provides some insight into the differences between them!