Variation is everywhere. It’s in your daily commute to work, it’s in the amount of caffeine you drink every day, in the number of e-mails that arrive in your inbox, etc. Whether you’re monitoring something as ordinary as caffeine consumption or something more important like a multi-million dollar manufacturing process, you can use one simple tool to monitor variation and determine whether the variation you’re seeing is due to natural random fluctuation or if your process is out of control due to some special cause.
The tool I’m referring to is the all-powerful control chart.
Now here's where it starts to get interesting...have you ever seen a control chart that looks like this?

At first glance, this process looks great—it’s in control. But looks can be deceiving. Do you see how the points, especially on the upper Xbar chart, are hugging the center line? Rather than having a beautiful stable process, what we instead have here are control limits that are too wide for the data, which means they will rarely signal an out-of-control situation.
What could be causing this to happen? The answer is subgroup size. After some investigation, I discovered that this control chart had been created using a subgroup size of 5 when in fact the data were collected one measurement at a time. Therefore, an I-MR chart should have been used instead of an Xbar-R chart, since I-MR charts are for subgroup sizes of 1 and Xbar-R charts are for subgroup sizes greater than 1 (and typically less than 9 or 10).
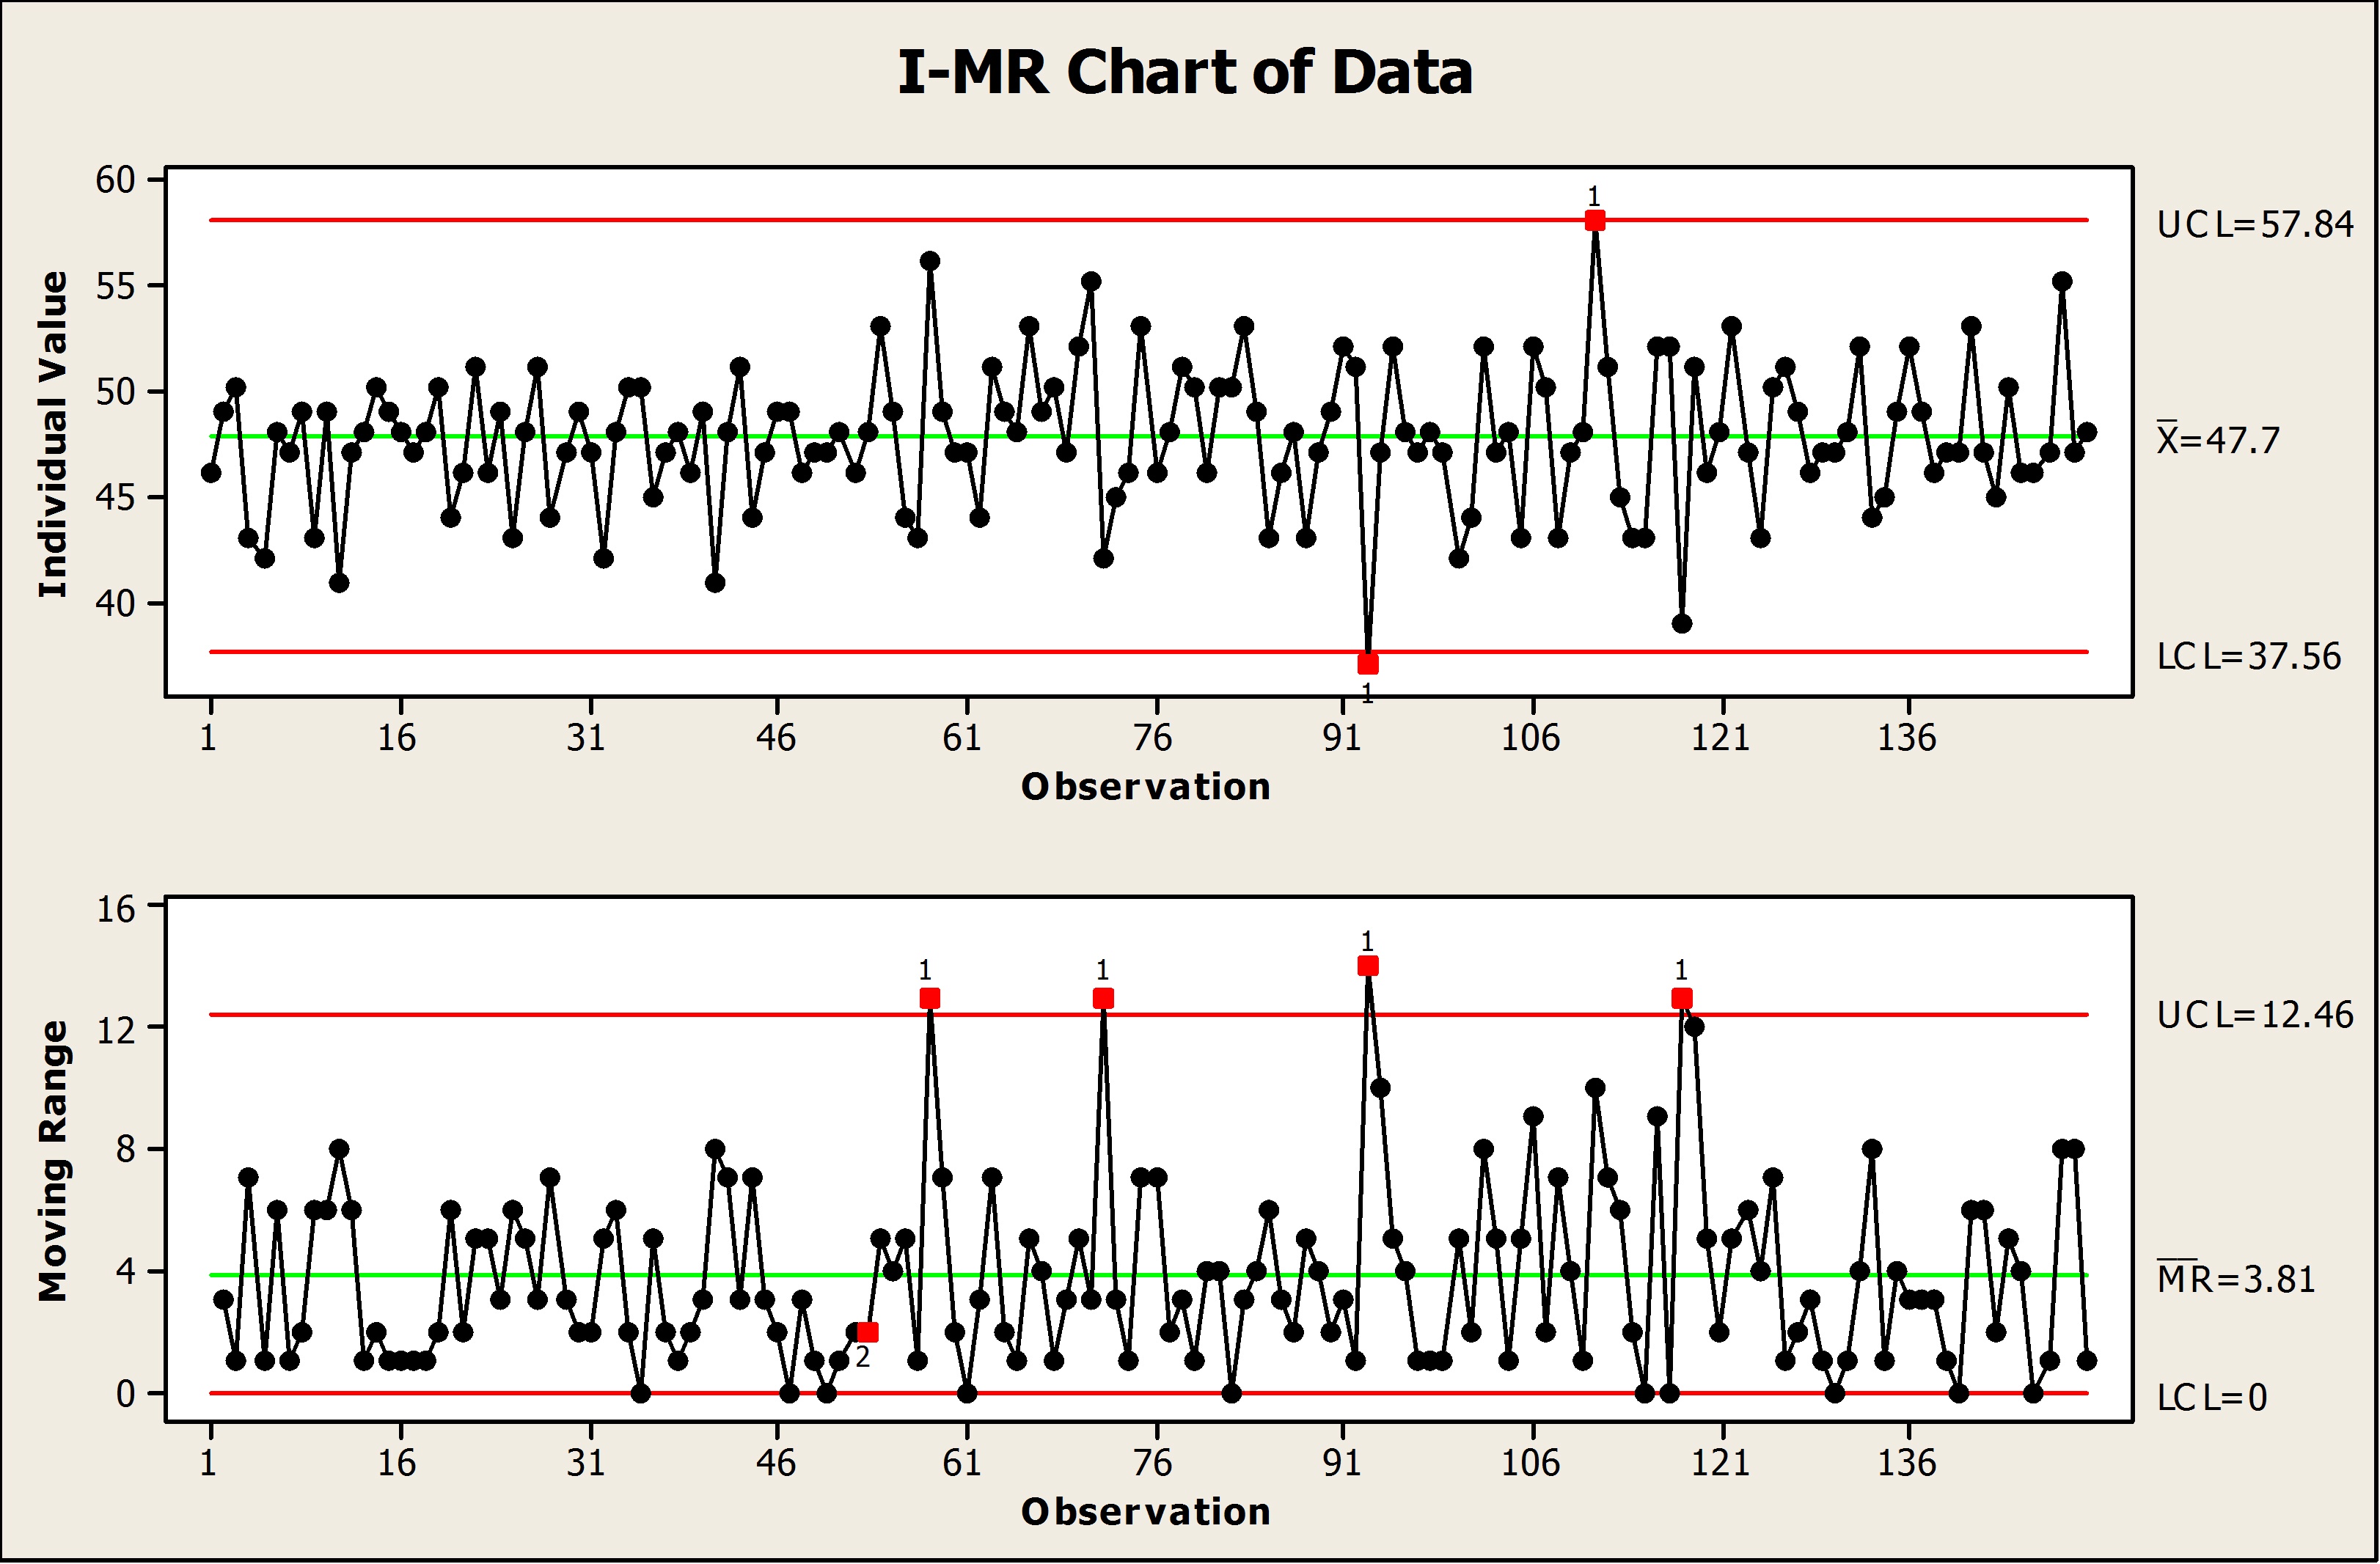
If we instead use the real subgroup size reflective of how we collected the data, here is what we see:

This process is in fact out of control, a fact that we would have missed using a subgroup size of 5.
The moral of the story? The subgroup size you specify in Minitab Statistical Software must reflect how the data were collected. Any old number will not do. Statistically speaking, this will ensure that your subgroups represent only common cause variation, or rather, the variation that naturally occurs in the process.
Got Minitab? If so, use the Assistant to easily catch bungles such as this one.


