Coming off an epic season finale of AMC’s The Walking Dead, I thought that zombies might be able to lend a hand in explaining the 2-Sample Poisson Rate test.
What Do Zombies Have to Do with the 2-Sample Poisson Rate Test?
Let’s say that you and a group of refugees are facing the zombie menace, and an area in which you are camping is soon to be overrun by the undead. In order to know which county to traverse next, you call in helicopter scout teams to observe land in two nearby counties.
- One helicopter observes County A and looks at the first 40 acres of land, recording the number of zombies in each acre.
- The second helicopter observes County B and looks at the first 60 acres of land. In an interesting attempt to speed up the process, the scouts decide to record the number of zombies every 2 acres.
So how do you know if one county is a better option? We can do a hypothesis test! The 2-Sample Poisson Rate test compares two samples from Poisson processes by performing hypothesis tests and calculating confidence intervals for the differences between the two populations:
- Occurrence rates
- Mean numbers of occurrences
A Poisson process describes the mean number of occurrences of an event in a given length of time, area, volume, etc. In our situation, we are tracking the number of zombies within a given acre, or 2-acre span.
The Poisson Analysis
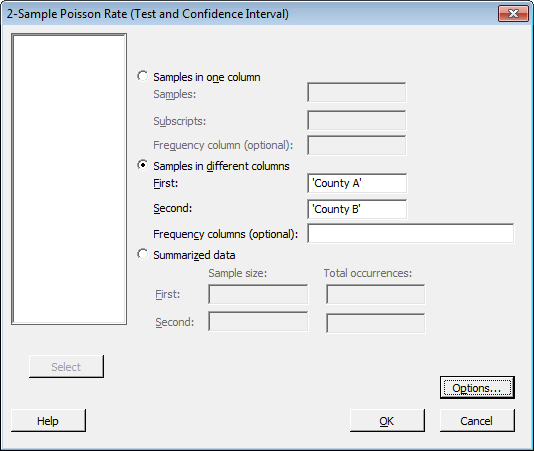
The helicopter scouts were able to successfully transmit the data wirelessly to your embattled laptop, which, fortunately, has Minitab Statistical Software installed. (If you want to play along, you can download the data here.) With the data imported into a Minitab worksheet, you go to Stat > Basic Statistics > 2-Sample Poisson Rate. The dialog box is completed as follows:
Then you click on the "Options" button, and fill that dialog out like this:
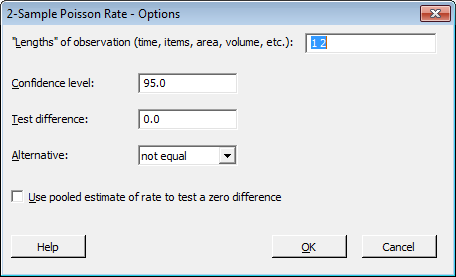
You see that “1 2” was specified under “Lengths” of observation. This is done to make a distinction between how the zombies were recorded in each county. As mentioned before, Helicopter B decided to record the number of zombies from 2-acre plots of land instead of 1-acre plots (Helicopter A). Make sure that the order in which you specify the lengths of observation matches the order of the samples as listed in the main dialog.
Two-Sample Poisson Rates
Minitab gives us the following output:
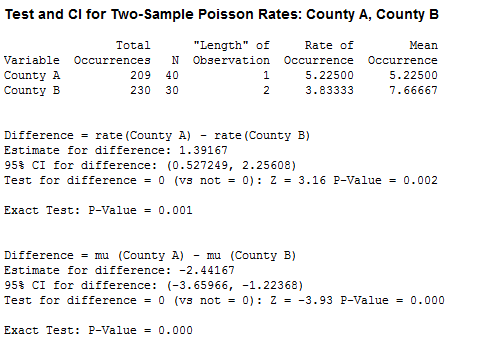
The output provides statistics about zombie infestation rates for each county, which will help in determining whether they are statistically different from each other. Your hypotheses for the difference in rates:
- Null Hypothesis, or Ho: The true value of the difference between the population rates is equal to zero.
- Alternative Hypothesis, or Ha: The true value of the difference between the population rates is not equal to zero.
Because the p-value is less than 0.05 (your alpha value), you reject the null hypothesis.
A Data-based Decision about Surviving Zombies
Based on the results obtained in your 2-sample Poisson Rate test, your group decides to venture into County B because it appears to have a lower zombie infestation rate. Less zombies = higher survival rate.
You’d better turn that laptop off though; the light from the monitor might give away your location!