


There are times when we are deep in a particular analysis and simply cannot seem to get past this dialog window, or that error message. Fortunately, the support team at Minitab is here to help.
Here is a list of situations people have called us about when using Minitab, and how to solve them.
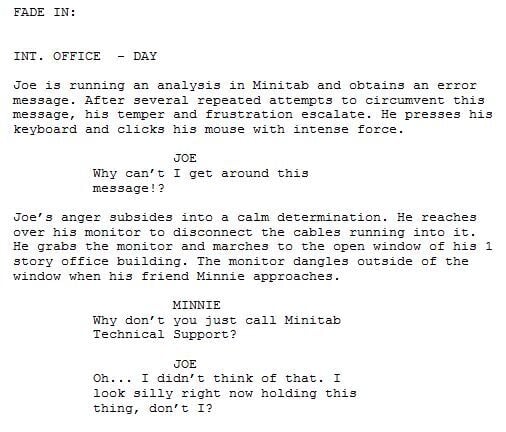
If your situation isn't listed, please call Minitab Technical Support, and we will be happy to assist. There's no need to take your frustrations out on your hardware like Joe did!
Sorry, You’re Not My (Data) Type
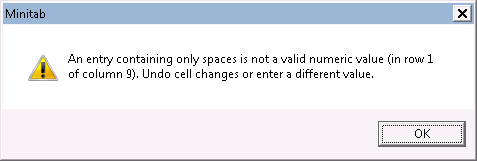
This message appears after entering a space in a cell of a numeric formatted column. Numeric columns will not accept text or spaces. After pressing OK in this window, you may be inclined to click somewhere else to continue your work. However, you’ll quickly realize that Minitab won’t let you continue until you remove that space from the column. Simply press the backspace key on your keyboard to remove the space.
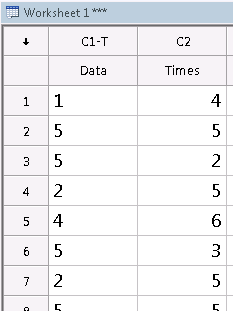
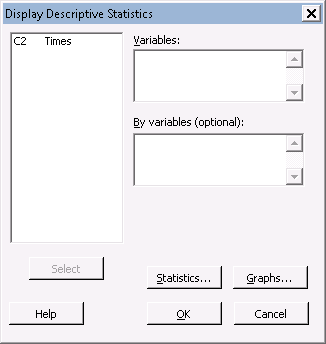
You Look Like You’ve Seen a Ghost
When you put your mouse cursor in the ‘Variables’ box in the dialog window of Display Descriptive Statistics, you’ll see that C1 is not listed in the box to the left. The numbers are listed in C1 though, right? Minitab is interpreting C1 as a text column, and the Variables box is a smart cookie. It will only recognize numeric columns. You’ll need to convert C1 into numeric by going to Data> Change Data Type> Text to Numeric.
Editor-in-Chief
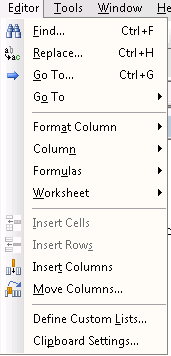
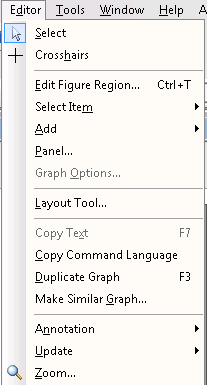
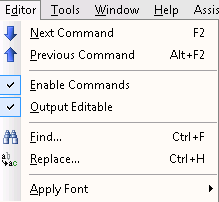
The contents of our Editor menu can change depending on what part of Minitab you are currently clicking on with your mouse. If you can't find what you are looking for under the Editor Menu, please make sure that you are selecting the appropriate area.
| Worksheet Selected | Graph Window Selected | Session Window Selected |
|---|---|---|
 |
 |
 |
Lost and Found
Here are some shortcut keys that will utilize Minitab’s Project Manager to arrange what you are looking for, in the event you can't find that particular graph or worksheet, or session output.
CTRL+ALT+M: This shows a list of your analyses that were shown in the session window, as well as any graphs that were created along with it.
CTRL+ALT+D: This shows a list of your worksheets in your project.
CTRL+ALT+G: This shows a list of your graphs in your project.
Waiter, May I Please Have A Menu?
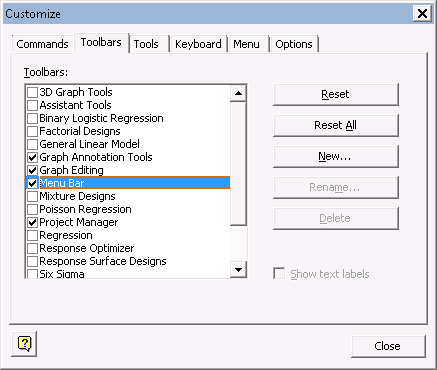
You may have been handed a computer with Minitab installed and found that some menus were missing. Someone may have customized Minitab and had them removed. You can return the menu toolbar to it’s original format by going to Tools > Customize > Toolbars. Single click on ‘Menu Bar’ under the toolbars list, and then click on the Reset button. You’ll receive a warning that your menu changes will be lost. Go ahead and hit OK to return the menu to its default setting.
Command and Conquer
There may be a time when you want to run commands to generate Minitab output as opposed to using our dialog boxes. This can be done in one of two ways:
- You can enter commands directly into our Session Window. You’ll need to enable our command line editor though. This is done using Editor > Enable Commands.
- You can use our Command Line Editor to run commands as well. This is found in Edit > Command Line Editor (or press CTRL+L on your keyboard).
For a list of session commands used in Minitab, please go to Help > Help > References > Session Commands.
Restricted Imports
You are pasting data using CTRL+V from Excel into Minitab and get an error box that says
"A run-time error has been raised. Please report this to Minitab Technical Support or your distributor."
We do our best to anticipate the many kinds of data that people want to import into Minitab, but sometimes special formats or characters in the data set may get the best of us. There are a couple of ways to get around this so that you can import your data into Minitab successfully:
- In Minitab, use File > Open Worksheet instead. Under the drop-down labeled “Files of Type” choose Excel(*.xls, *xlsx) to filter for Excel files.
- Save your original file as an Excel .csv file, then copy and paste into Minitab.
Seeing Red
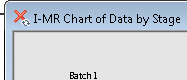
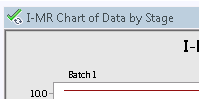
You have a graph set to update automatically when you add data to the worksheet. If the creation of that graph required multiple columns, then you’ll need to update each of those columns if you want the graph to continue to update. For example, if you created a control chart with a time stamp and stages, that’s 3 columns of data that were used. If you only update your measurement column, you’ll see that your update icon in the upper left corner of the graph will change to red X. Once you enter in data for your time stamp and your stage columns, the graph will update automatically. Your X will turn into a green check. The pictures below show the upper left corner of two control chart graphs.
Do you have any tips of your own to share? Or any situations you'd like to see covered in a future post on the Minitab Blog? We'd love to hear from you!