


Ahh, bottled water. Refreshing, convenient...and sometimes pricey. Or in my case, I should say usually pricey. Confession: I’m a sucker for water that comes in the “pretty” plastic bottles, and my experience is that the pretty-bottle brands are usually the pricier ones. Does bottled water cost increase with the fanciness of the bottle? Well, that could be an analysis for a different day …
My colleague recently shared some interesting stats about the buying and disposing of plastic bottled water containers (Maybe she’s noticed my excessive use of “pretty” bottled waters …?).
According to the organization Ban the Bottle, making bottles to meet America’s demand for bottled water requires more than 17 million barrels of oil annually, which is enough to fuel 1.3 million cars for 1 year. They also cite that Americans consume more than 48 billion bottles of water annually, which is enough bottles to circle the earth 230 times!
While these bottled water facts are certainly enough to convince me to scale back on my “pretty” bottled water habit, a visual representation of data in the form of a Minitab graph is also compelling.
Check out the overlaid time series plot below that shows data published by the Container Recycling Institute on the number of plastic bottled water containers sold, recycled, and wasted for 1991-2013:
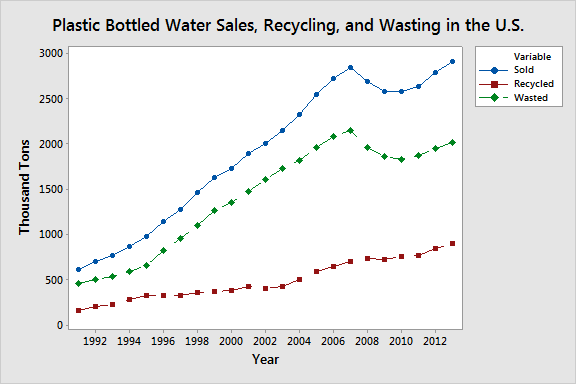
You can see that bottled water sales have largely risen over the past 20+ years, although it’s interesting to note that they were potentially impacted by the economic downturn in 2008. And while recycling rates have seen a gentle increase, they have not seen enough of an increase to come even close to the volume of bottles wasted (and not recycled) over the years.
This is certainly food for thought when considering whether or not you should fork over a buck or two for a bottle of water—or in my case, $4 or $5 for the “pretty” bottled water—and whether or not you should throw those bottles in the garbage can!
For more on creating time series plots in Minitab, visit this article from Minitab Support.