


Among the most underutilized statistical tools in Minitab, and I think in general, are multivariate tools. Minitab offers a number of different multivariate tools, including principal component analysis, factor analysis, clustering, and more. In this post, my goal is to give you a better understanding of the multivariate tool called discriminant analysis, and how it can be used.
Discriminant analysis is used to classify observations into two or more groups if you have a sample with known groups. Essentially, it's a way to handle a classification problem, where two or more groups, clusters, populations are known up front, and one or more new observations are placed into one of these known classifications based on the measured characteristics. Discriminant analysis can also used to investigate how variables contribute to group separation.
An area where this is especially useful is species classification. We'll use that as an example to explore how this all works. If you want to follow along and you don't already have Minitab, you can get it free for 30 days.
Discriminant Analysis in Action
I have a data set with variables containing data on both Rocky Mountain and Arctic wolves. We already know which species each observation belongs to; the main goal of this analysis is find out how the data we have contribute to the groupings, and then to use this information to help us classify new individuals.
In Minitab, we set up our worksheet to be column-based like usual. We have a column denoting the species of wolf, as well as 9 other columns containing measurements for each individual on a number of different features.
Once we have our continuous predictors and a group identifier column in our worksheet, we can go to Stat > Multivariate > Discriminant Analysis. Here's how we'd fill out the dialog:
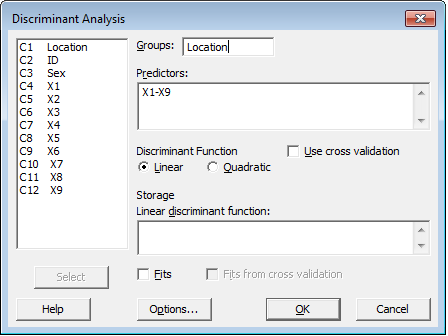
'Groups' is where you would enter the column that contains the data on which group the observation falls into. In this case, "Location" is the species ID column. Our predictors, in my case X1-X9, represent the measurements of the individual wolves for each of 9 categories; we'll use these to determine which characteristics determine the groupings.
Some notes before we click OK. First, we're using a Linear discriminant function for simplicity. This makes the assumption that the covariance matrices are equal for all groups. This is something we can verify using Bartlett's Test (also available in Minitab). Once we have our dialog filled out, we can click OK and see our results.
Using the Linear Discriminant Function to Classify New Observations
One of the most important parts of the output we get is called the Linear Discriminant Function. In our example, it looks like this:
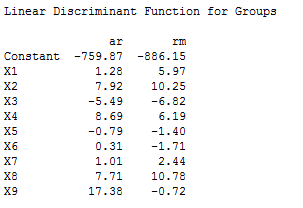
This is the function we will use to classify new observations into groups. Using this function, we can use these coefficients to determine which group provides the best fit for a new individual's measurements. Minitab can do this in the "Options" subdialog. For example, let's say we had an observation with a certain vector of measurements (X1,...,X9). If we do that, we get output like this:
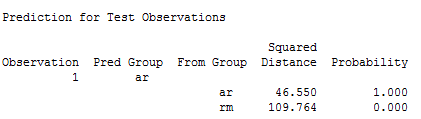
This will give us the probability that a particular new observation falls into either of our groups. In our case, it was an easy one. The probability that is belongs to the AR species was 1. We're reasonably sure, based on the data, that this is the case. In some cases, you may get probabilities much closer to each other, meaning it isn't as clear cut.
I hope this gives you some idea of the usefulness of discriminant analysis, and how you can use it in Minitab to make decisions.