


It’s usually not a good idea to rely solely on a single statistic to draw conclusions about your process. Do that, and you could fall into the clutches of the “duck-rabbit” illusion shown here:
If you fix your eyes solely on the duck, you’ll miss the rabbit—and vice-versa.If you're using Minitab Statistical Software for capability analysis, the capability indices Cp and Cpk are good examples of this. If you focus on only one measure, and ignore the other, you might miss seeing something critical about the performance of your process.
Cp: A Tale of Two Tails
Cp is a ratio of the specification spread to the process spread. The process spread is often defined as the 6-sigma spread of the process (that is, 6 times the within-subgroup standard deviation). Higher Cp values indicate a more capable process.
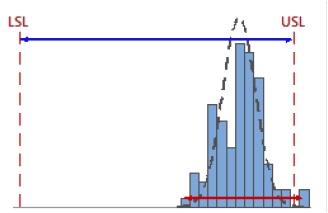
When the specification spread is considerably greater than the process spread, Cp is high.
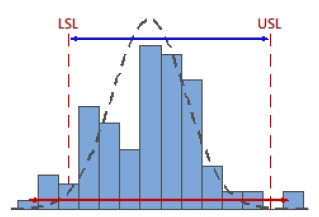
When the specification spread is less than the process spread, Cp is low.
By using the 6-sigma process spread, Cp incorporates information about both tails of the process data. But there’s something Cp doesn’t do—it doesn’t tell you anything about the location of the process data.
For example, the following two processes have the about same Cp value (≈ 3):
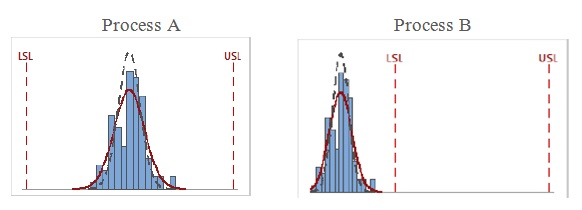
Obviously, Process B has a serious issue with its location in relation to the spec limits that Cp just can't "see."
Cpk: Location, Location, Location!
Like Cp, Cpk is also a ratio of the specification spread to the process spread. But unlike Cp, Cpk compares the distance from the process mean to the closest specification limit, to about half the spread of the process (often, the 3-sigma spread).
When the distance from the mean to the nearest specification limit is considerably greater than the one-sided process spread, Cpk is high.
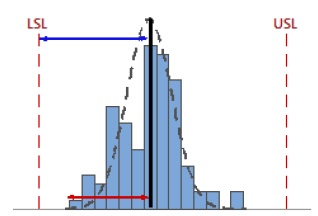
When the distance from the mean to the nearest specification limit is less than the one-sided process spread, Cpk is low.
Notice how the location of the process does affect the Cpk value—by virtue of its being calculated using the process mean.
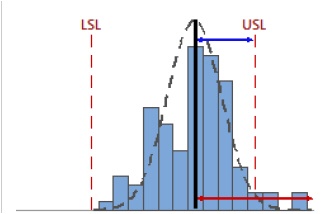
Yet there's something important that Cpk doesn't do. Because it's a "worst-case" estimate that uses only the nearest specification limit, Cpk can't "see" how the process is performing on the other side.
For example, the following two processes have the about same Cpk value (≈ 0.9):
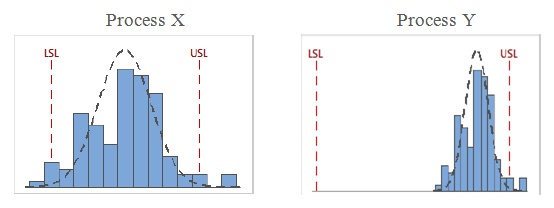
Notice that Process X has nonconforming parts in relation to both spec limits, while Process Y has nonconforming parts in relation to only the upper spec limit (USL). But Cpk can't "see"any difference between these two processes.
To get the two-sided picture of each process, in relation to both spec limits, you can look at Cp, which would be higher for Process Y than for Process X.
Summing Up: Look for Ducks, Rabbits, and Other Critters as Well
Avoid getting too fixated on any single statistic. If you have both a lower and upper specification limit for your process, Cp and Cpk each might “know” something about your process that the other one doesn’t. That “something” could be critical to fully understand how your process is performing.
To see a concrete example of how Cp and Cpk work together, using real data from the National Renewable Energy Laboratory, see this post by Cody Steele.
By the way, the potential "blind spot" for Cp and Cpk also applies to Pp and Ppk. The only difference is that the process spread for those indices is calculated using the overall standard deviation, instead of the within-subgroup standard deviation. For more on that distinction, see this post.
And if you’re interested other optical and statistical illusions, check out this post on Simpson's paradox.