


If you’ve checked out What’s New in Minitab 17, you’ve had the chance to see that Conditional Formatting leads the list. If you’ve been reading the Minitab blog, you’ve had the chance to see demonstrations with Marvel’s Avengers and the Human Development Index. But you might not have had a chance to see that you can highlight large standardized residuals from a regression model and that the highlighted cells will update when your model updates.
To demonstrate, we’re going to look at data from a study where researchers sterilized males in herds of wild horses to evaluate the effectiveness of sterilization in reducing birth rates.
For Minitab to identify data rows with large residuals, you first need a regression model that can have large residuals. Do this first:
- Choose Stat > Regression > Regression > Fit Regression Model.
- In Responses, enter Foals.
- In Continuous predictors, enter Adults ‘Sterile_Males’.
- Click OK.
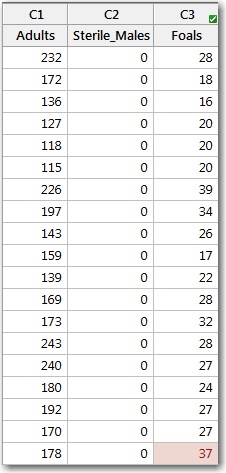
When you click OK, a white checkmark in a green box appears next to the C3 above the response column. The checkmark indicates that the column is the response variable for a model. Minitab keeps track of the model to allow appropriate analyses—like highlighting the observations with large residuals:
- Click any cell in the response column with the number of foals.
- Right-click in the worksheet and choose Conditional Formatting > Statistical > Large Residual.
- Click OK.
Minitab shades the herd with 37 foals. According to the model, that herd has a lot of foals, even taking into account the number of adults.
But wait, there’s more! If you look at the regression equation that fits the data best, you see that the size of the herd explains most of the variation in the number of foals. The number of sterile males is not statistically significant.
Coefficients
Term Coef SE Coef T-Value P-Value VIF
Constant -2.60 3.19 -0.81 0.421
Adults 0.1593 0.0187 8.53 0.000 2.61
Sterile_Males 0.114 0.314 0.36 0.719 2.61
If you change your model to include the square term for the number of sterile males, then the variable is statistically significant.
Coefficients
Term Coef SE Coef T-Value P-Value VIF
Constant 8.27 3.91 2.12 0.042
Adults 0.1003 0.0220 4.55 0.000 5.07
Sterile_Males -3.381 0.947 -3.57 0.001 33.08
Sterile_Males*Sterile_Males 0.2795 0.0727 3.85 0.001 20.33
More interesting for today’s demonstration though, is what happens in the worksheet. Even though you didn’t change any formatting rules for the response variable, two rows are now highlighted.
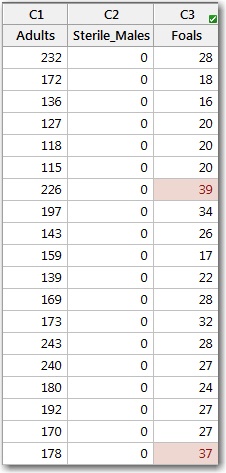
With the new model, 39 foals in a herd is also higher than we would expect. Minitab keeps the conditional formatting up-to-date for you!
Making your data easier to use is a compelling advantage in Minitab 17.2. Conditional formatting makes it easier to find important observations in your data that you want to highlight.
Of course, you can do more than identify unusual observations in a regression analysis. If you’re ready for more, check out the Conditional formatting overview and the accompanying examples.