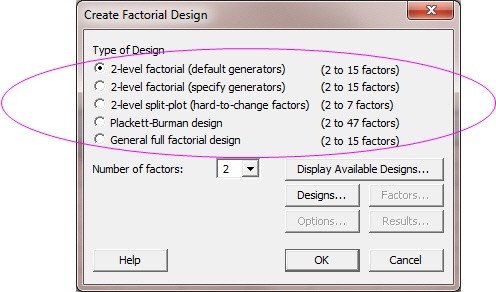
Having spent some time figuring out what to do with the different variables for our gummi bear experiment, it’s time to get into Design of Experiments with Minitab. Opening Stat > DOE > Factorial > Create Factorial Design presents you with 5 options to choose from immediately:

The dialog box is helpfully explaining that some of these designs are for different numbers of factors. For example, if you want to create an experiment to study more than 15 factors in Minitab Statistical Software, you’re directed to a Plackett-Burman design.
This is somewhat helpful if you know what a factor is. Because I’ve been using the term “variable,” I’ll explain that here, factor means a variable that we can measure, can control, and are planning to intentionally manipulate so we can learn about it. We discussed factors when we were planning to use design of experiments.
When I used gummi bears to illustrate Measurement Systems Analysis (MSA) studies, I chose 5 variables from my fishbone diagram to examine. All of the types of factorial designs in Minitab can be used to study 5 factors. So which design should we choose? To build your confidence in selecting the right type of design, I’ll describe them all over the next few posts. We’ll start at the bottom of the list with general full factorial designs.
The special feature of general full factorial designs is that they accommodate factors with more than 2 levels. "Levels" refers to the measurements we’re going to observe in the experiment. For example, if the gummi bear experiment was going to include different shapes of candy, one of our variables might have the levels “bears,” “fruit,” "legos," and “dinosaurs.” Shape would then be a factor with 4 levels, and the experiment could be to created in Minitab as a general full factorial design.
I usually leave off by directing you to some more statistical information, but explaining statistical vocabulary makes me tired. If you understand the terms “factor” and “level,” you should treat yourself to some gummi bears!


