


Surveys have become commonplace in almost every industry, especially with the use of smartphones and social media. Survey data can help analysts understand customer behavior and attitudes.
And it's not as direct as reading a number off a gage. Questions need to be constructed to get at the complex social phenomenon of behavior. The wording, responses to select from and process of collecting respondents all are part of a complex structure to collect meaningful data.
Minitab Statistical Software has tools to help analysts to
- Organize data: from structure to cleaning up,
- Simplify data: from clustering/segmentation to dimension reduction,
- Visualize data: from categorical to numeric data, and
- Analyze data: from descriptive to predictive analysis.
Organize Data
Minitab has tools and features to help analysts with any step of their analysis, and one of the most complicated steps is the first step: collecting, importing and organizing data. Depending on the software you use to collect your data or the method used to input the data into a program, it might require a little restructuring or cleaning.
Depending on how data are collected, analysts might want to remove extra spacing, extract or find specific words, want to separate text input into multiple columns, standardize case type of text and/or want to combine different columns into one. Using Minitab’s Calc > Calculator, an analyst can use many textual commands to address the above issues:
- Clean
- Concatenate
- Fixed
- Item
- Left, Right, Mid
- Upper, Lower, Proper
- Search
- Trim
- Word
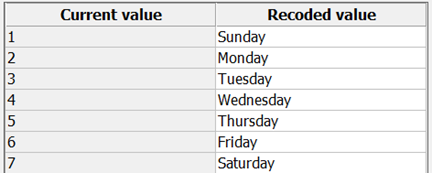
Minitab also offers users an easy way to handle typos or recoding responses for graphical reasons under the Data > Recode menu. For smaller recoding job, the standard Data > Recode > To Text can easily handle recoding without having to create long winded nested-if/then statements. Easily fill in the table to recode responses:
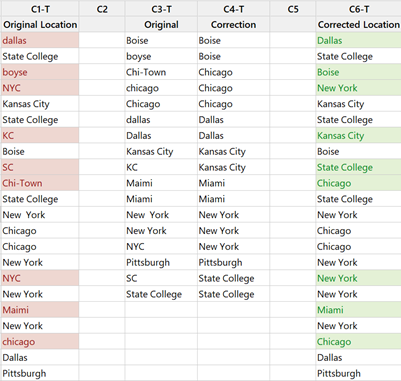
For much larger surveys with the potential of multiple typos that requires some human intervention to fix would need a little more work using a Conversion Table. In the example below, C1 has multiple spelling and case mismatches and a conversion table was used to fix the original data in C3 to the new standardized code in C4.
Other useful data structuring and handling tools can be found in Minitab’s Data Menu or Calc Menu.
Simplifying Data
Some companies might be implementing focus groups or survey customers. A lot of consumer goods products might ask customers about new designs, feedback, etc. Human Resource departments might implement social psychological surveys to understand people when they hire them. These surveys could lead to a multitude of data and require simplification techniques to easily analyze the data or graph the data.
An easy way someone could do this is by creating an arbitrary index value using Minitab Calculator. For example, averaging the responses, adding them up to a grand total, etc. A more statistically backed process of taking multiple variables and combining them into a smaller subset of variables can be achieve with Factor Analysis, Principal Components or Variable Cluster Analysis. These methods can help reduce the number of variables to analyze or graph for easy interpretation.
Some companies might be interested in segmenting customers into specific categories to focus marketing campaigns. A lot of information could be collected on customers via an app or website to help create segments using Minitab’s Observation Clusters Analysis, K-Means Clustering, or Discriminant Analysis.
Creating these segmented groups or clusters can help optimize resource allocation. A Hospital management company could use a survey sent to their hospital administrators to understand problems or issues impacting specific hospitals and can use clustering to create statistically defined groups to determine if hospitals are similar or not to explore group specific improvement initiatives.
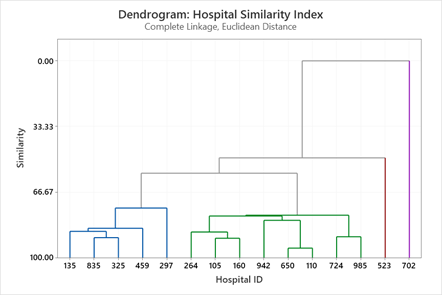
In the Dendrogram above, we see Hospital ID 523 and 702 are the most different. We can see the blue group and green group of hospitals are more similar. Further analysis will need to be conducted to determine if these are positive or negative differences.
Visualizing Data
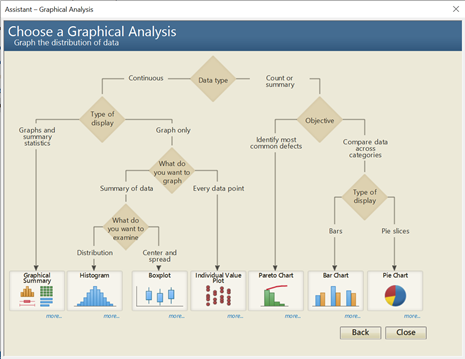
Our statisticians and programmers at Minitab understand the needs of analysts, we make intuitive tools that are easily accessible for any type of data you have. The Minitab’s Assistant > Graphical Analysis gives power to users to select the appropriate tools for their analysis.
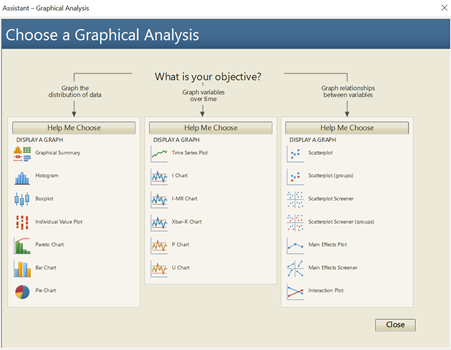
Analysts need to answer the first question What is your objective? Then, if the user needs more assistance, they can click Help Me Choose for a more detailed decision tree.
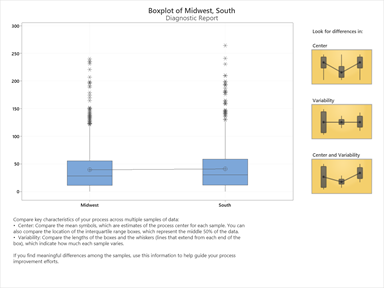
Minitab’s Assistant menu is not only helping analysts choose the correct graph but will also advise users to identify potential patterns in the data. In the graph below, the Diagnostic report helps the analyst understand typical patterns to analyze and talk about.
Analyzing Data
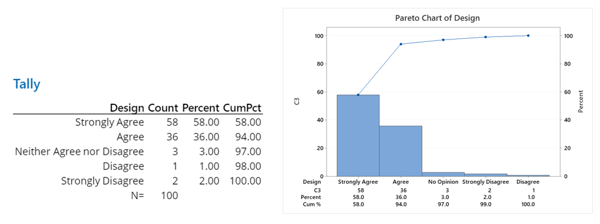
Minitab has plenty of tools for descriptive and predictive analytics. Suppose an R+D team, at a surgical device company, survey surgeons about a new design of a product. The Tables menu has tools designed to handle quantifying categorical responses or can use a Pareto Chart to help visualize the data.
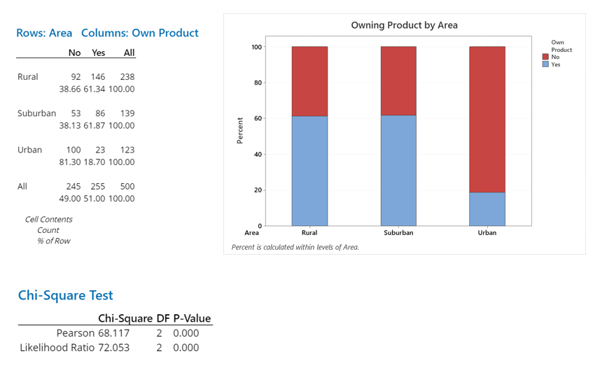
A Cross Tabulation and Chi-Square can be used to analyze and understand how two variables are related. A Stacked Bar Chart was added to help visualize the bivariate relation of a marketing customer survey. In the below example, there seems to be a statistical difference in the rate of ownership between the regions: Urban, Suburban and Rural, where Urban respondents do not own the product.
Predictive tools can also be used to explore relationships and make impactful business decisions. The Binary Logistic Regression can predict the probability of having a specific event happen and can be used to determine decision rules to use to standardize decisions to prevent any potential issues.
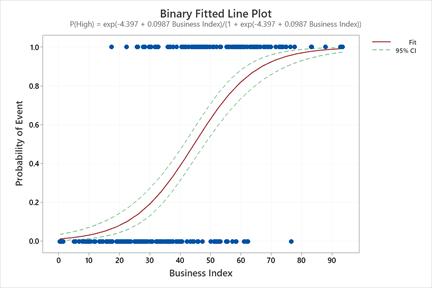
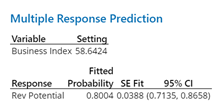
Above the company used their own Business Index Survey of previous companies they have worked with and measured the amount of revenue that was generated from the clients and determined in the corporate client was high or low revenue generating. The company will implement this same Business Index Survey for all future new corporate clients to make decisions about how to sell to the clients. Using the Prediction tool, the analyst determined that a Business Index Survey score of at least 58.6 then the client will have an 80% chance of that client being high revenue.
Delving Deeper into Survey Data
From calculating sample size to sophisticated analysis, Minitab has the tools needed to analyze survey data and make sound conclusions for your business. For more information and additional examples detailing how to use these and other useful tools, Minitab offers an extensive Help system and free Technical Support.