


Have you ever heard of an Alligator Pear? If not, don't worry. You're not alone! Surprisingly, it's another name for an avocado.
As trendy as avocados have become lately, they have been around and used in popular dishes around the world for hundreds of years. Guacamole, for example, was created by the Aztecs and dates back to some time between the 14th and 16th centuries! As this delicious green dip and other avocado-heavy dishes continue to gain popularity, the demand for avocados rises. With a limited supply, the cost increases as well creating issues for both consumers, restaurants and food manufacturers alike.
A Simple Swap: Calabacitas for Avocados?
Given the skyrocketing price of avocados thanks to global demand, a guacamole manufacturer decided to see if they could substitute a few avocados in their guacamole in favor of calabacitas, a bright green, little Mexican squash with similar characteristics; a trick that is sometimes used in the restaurant industry. However, with a loyal following, the manufacturer worried about changing the recipe and putting its brand at risk. The guacamole manufacturer decided to run a test and ask a sample group to taste and rank its “Classic” guacamole recipe versus its “New” recipe using avocados and calabacitas.
As a marketer myself, I know one of the most daring and convincing marketing campaigns is for a food manufacturer to conduct taste tests comparing their food to the competition. Aside from being a marketing tool, taste tests can seriously help restaurants introduce new foods and try new recipes. And food manufacturers can use taste tests to substitute ingredients for a number of beneficial results, including making them healthier or less expensive to produce.
Restaurants introduce things on their menu and rely on word of mouth from wait staff or customers to determine if the new menu items are up to standard. Larger chains and manufacturers can test foods in sample markets. T-tests are a simple way to conduct a taste test, no matter how large or small your operation.
The guacamole manufacturer gathers people to taste test, makes the two guacamoles to be ranked and starts collecting data, but without any statistical background, they turn to Minitab for help with their T-tests!
Have you ever thought of making your own wine?
Learn how Statistical Quality Control can help you ensure consistent product every time
Putting your Taste Test ... to the Statistical Test!
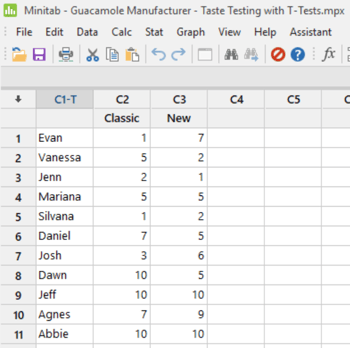 To accurately compare the two product formulations, we asked 25 panelists to try both the Classic and New recipes and score taste on a 1-10 scale, where 10 has the best flavor.
Knowing we needed to minimize bias, we randomized the order that our panelists tried the recipes so approximately half the group tried Classic first, while the other half tried New first. We also masked the two formulations during the test to remove any preconceived opinions the panelists might have about them.
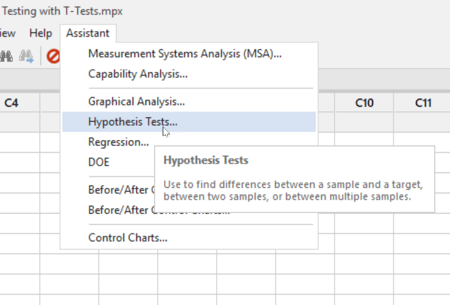
The data is easy to enter, as you can see above. To analyze this data, the Minitab Assistant can guide and help you with the analysis and reporting. By hovering over the Hypothesis Test menu shown on the left above, the Assistant explains some of the options.
When you click on hypothesis test, a new window will open that will present a map asking what you would like to do. In our taste test example, we want to compare the two samples with each other.
In this case, we know we want to compare two samples with each other, but as I’m using Minitab for the analysis I'm not sure which choice is appropriate so I click “Help Me Choose” under Minitab Assistant’s “Compare two samples with each other.”
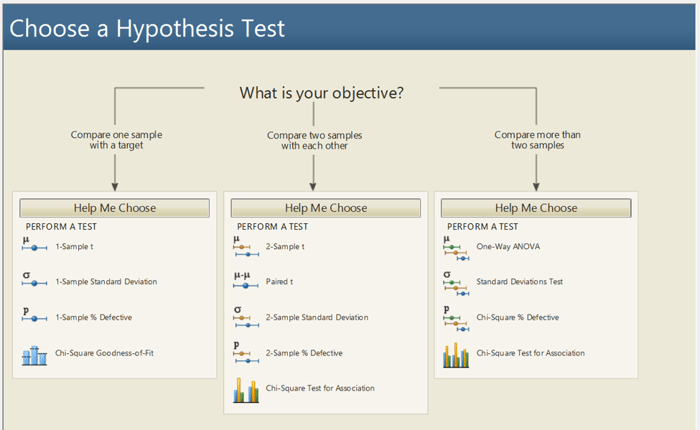
Now we also know that each panelist tasted both recipes, so we want to compare the recipe means for a matched set items. The Paired t is the appropriate test here because it considers that the observations in the Classic and New columns are not independent, as each panelist scored both recipes.
A Recipe for Ripe Results
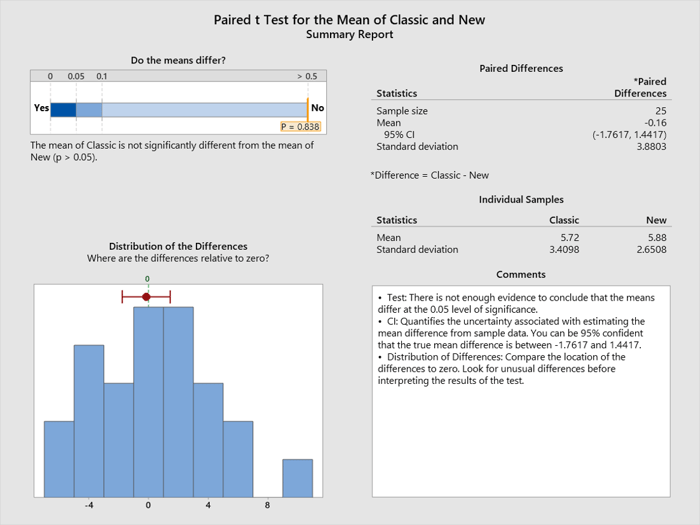
After Minitab runs the analysis, I get excited when I see the results. Minitab’s Summary Report tells me that the mean of classic is not significantly different from the mean of New. Minitab calculates the differences for each row, with those differences are plotted in the histogram. The average difference is very close to zero (-0.16) and the red interval provides a range for the true mean difference, telling me that the two recipes are not different after all. This means my taste testers could not detect a difference between the recipes!
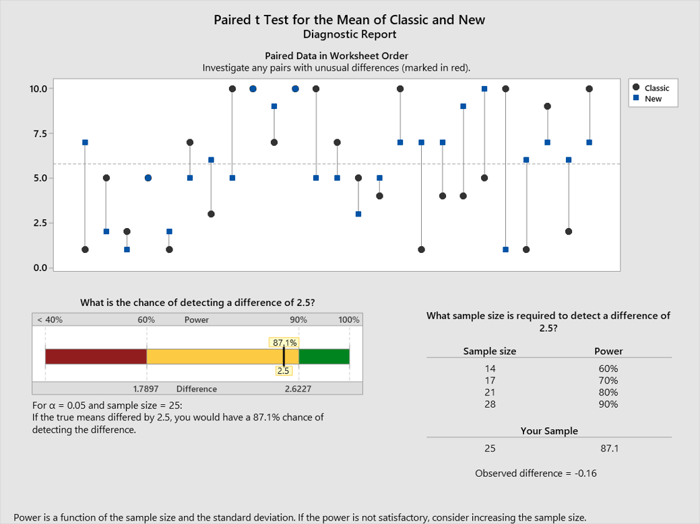
Before I get too excited about the results, I need to verify that my test had adequate power. Statistical power is the probability of detecting an effect, assuming it exists. I want to avoid the mistake of assuming there is no difference between the recipes based solely on the fact that I had a weak experiment. Minitab easily helps me out here by calculating the probability of detecting the practical difference between the recipes using Minitab's Diagnostic Report.
Given my sample size, I had an 87.1% chance of detecting the difference as shown below. This tells me that my test was not weak, meaning it had adequate power to detect a difference between the recipes.
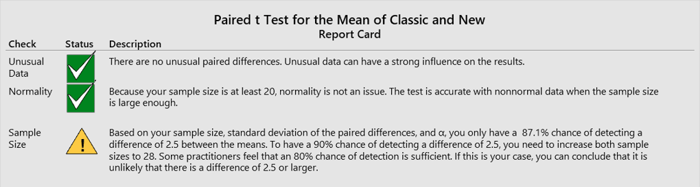
As I read further down Minitab’s report card, I'm informed that there are no unusual data points and that normality is not an issue. It reiterates I had an 87.1% chance of detecting a difference and that some practitioners feel that an 80% chance of detecting is sufficient, so I can trust the original results and my conclusion.
Delicious Final Decision
This experiment was a success thanks to basic statistics! Based on the final results and the experiment verification, we figured out that the guacamole manufacturer can change their product to the new recipe with the calabacitas and avocado mixed with the confidence they will be able to keep their manufacturing costs down without sacrificing in taste.
For more information on these methods, how to implement these statistical tools or other ways Minitab can help you improve your processes, please Talk to Minitab or contact your Minitab representative.
Have you tried Minitab Statistical Software yet?
Register today to start your free trial and experience all our latest features