


In a webinar now available on demand, I share tricks for Classification and Regression Trees (CART) in Minitab Statistical Software. We explore CART results, set penalties for certain data conditions, and discuss best practices for working with your results. Today, I thought I’d give you a taste of what you can expect.
Tips & Tricks for CART Webinar On Demand

What are Classification and Regression Trees (CART)?
CART is a modeling technique based on recursive partitioning that can be used to predict both continuous and categorical responses. These predictive models offer automatic variable selection, are easy to build in Minitab, and best of all, the model can be visualized as a decision tree that is easy to interpret. CART is useful as an alternative to linear or logistic regression when working with large observational datasets, or in the presence of complex nonlinear relationships..
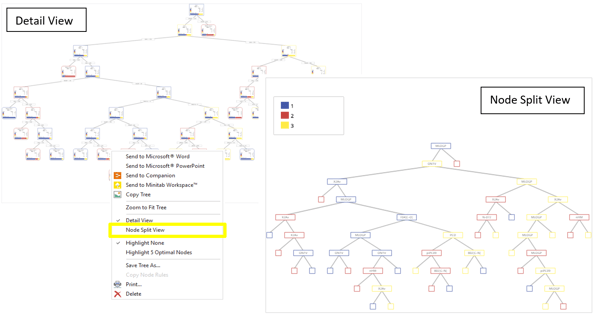
Tip #1: Use Node Split View for a high-level look at your decision tree
The detailed view of a large CART model can be a somewhat difficult to visualize, but thankfully Minitab offers an option to see a condensed view of the tree. Simply right-click on your CART model in Minitab and choose Node Split View. This condensed view only shows the predictor that was used each time the data was partitioned.
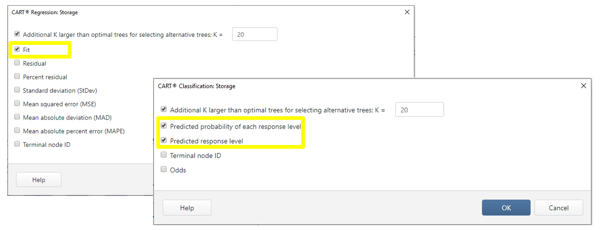
Tip #2: Store CART predictions in the worksheet
When the response or target variable is continuous, a regression tree model predicts the average in each terminal node. For categorical outcome variables, the prediction is the probability for each response level, as well as the predicted response level. To graphically explore the model’s predictions using other visualizations in Minitab, simply store the CART predictions in the worksheet using the Storage option.
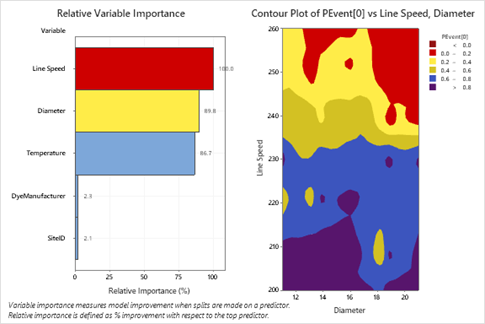
CART’s Relative Variable Importance graph displays the predictors in their order of importance. The effect of those important predictors on the response can be visualized using Minitab’s graphing options. In the example below, the two most important continuous predictors in a classification model were used to visualize the predicted probability of the response event on a contour plot.
Tip #3: Apply penalties to predictors with a lot of missing values, or categorical predictors with a lot of unique values
Continuous or categorical predictors with many missing values, or categorical predictors with many levels can have an advantage over predictors with less levels or without missing values. As a result, one of these predictors can “take over” the tree, masking the effect of the other predictors. To address these data conditions, Minitab offers an option to apply penalties to predictors with a lot of missing values, or categorical predictors with a lot of unique values.
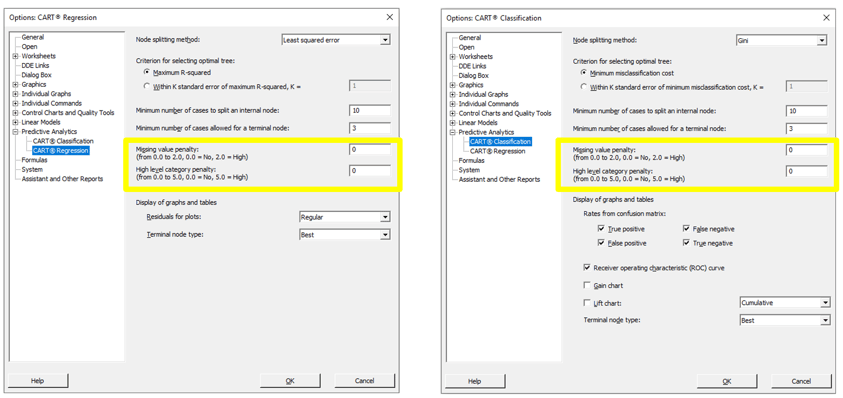
These penalties can be found through the Options menu, under File > Options. Penalties can be applied to both classification or regression trees, and the penalty values range from 0 to 2 for missing values and 0 to 5 for categorical predictors (where 0 is no penalty and the high value is the maximum penalty, respectively).
