Think about the last time you flew on an airplane. How was that experience? Most people can probably think of a couple aspects that affected their past flights, both positively and negatively, and ultimately shaped their satisfaction.
When it comes to air travel, passenger satisfaction is a key metric for airlines. Just knowing your passengers are satisfied is good, but knowing why they are satisfied is even better. These insights can really help an airline understand where their strengths are and where they can improve from their customers' perspective. Let's take a closer look.
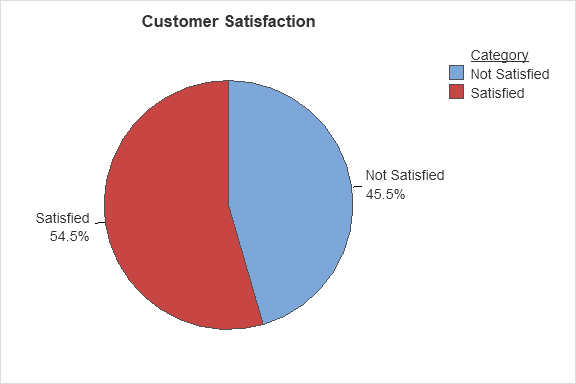
A customer satisfaction study asked passengers to rate their overall satisfaction, along with other aspects of their flight (e.g. seat location, ease of online booking, legroom, departure delay in minutes). This survey found that 54% of passengers were satisfied with their flight, which tells us that overall, a majority of customers are satisfied with their experience.
Understanding Why Customers are Satisfied
It is great to know that most customers are satisfied with their flight experience. The next logical questions are: why are the customers satisfied and what separates a satisfied customer from a neutral/dissatisfied customer? The survey has provided us with many predictors (>15) to investigate and a lot of data (over 100,000 rows). Leveraging the Predictive Analytics menu in the latest version of Minitab Statistical Software, we can use CART® to quickly identify the key drivers of customer satisfaction.
Ready to learn more about the latest version of Minitab?

CART®, or Classification and Regression Trees, is a decision tree algorithm that is used to help find important patterns and relationships in data variables. If the question or challenge you're facing has a binomial or multinomial categorical response, use CART Classification, while anything that has a continuous response with many categorical or continuous predictors should use CART Regression.
In this survey, we are categorizing customers into two groups, whether they are satisfied or not satisfied, so we will use CART Classification. The main idea behind CART is that we partition the predictor variables into different regions so that the dependent variable (also known as the target variable, which is satisfaction in this case) can be predicted more accurately. Minitab Statistical Software will automatically find the best decision tree for you and will provide model statistics, so you can understand if the model is useful.
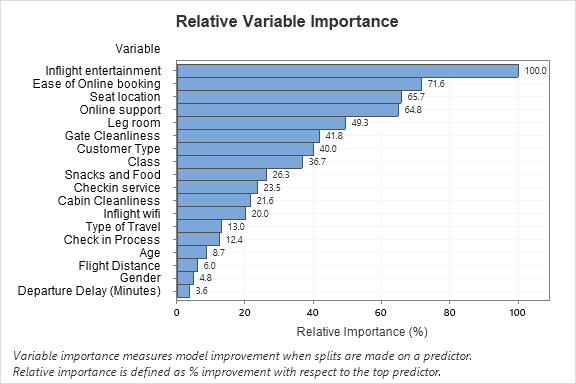
When analyzing this data, the default model is quite large — which is totally fine. Suppose you really just want to focus and understand the key drivers of satisfaction. In that case, the Relative Variable Importance plot can tell you which predictors are the most important variables to the tree.
As you can see below, inflight entertainment and seat comfort are the most important variables when predicting satisfaction, followed by ease of online booking and online support which also ranked highly as important.
Flexibility to Fit an Alternative Model
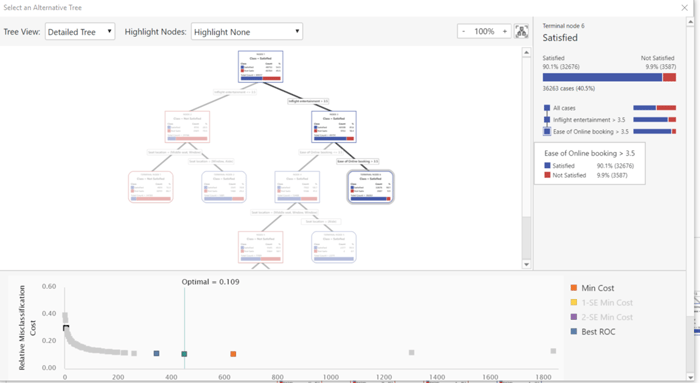
CART trees can often be quite large. Viewing a smaller tree with similar information can be useful, particularly if we plan to communicate our findings to others. Luckily, Minitab Statistical Software’s latest release contains an interactive model view that let us you explore, view and examine alternate models in one convenient window.
As you can see below, a much smaller tree has been selected, so we can view the key variables and splits.
Tree Diagrams to Help You Understand the Details
Now looking at the tree in greater detail, we can see that when inflight entertainment was rated greater than 3.5, approximately 81% of customers rate their experience as satisfied.

The red and blue indicator bar (shown above and in each node of the tree) makes those results easy to see with blue being satisfied and red being not satisfied. This also helps you notice that when customers rated the inflight entertainment less than 3.5, they tended to be more satisfied if the seat is near the window or aisle, but much less satisfied if they have a middle seat (follow the path on the left side of the tree).
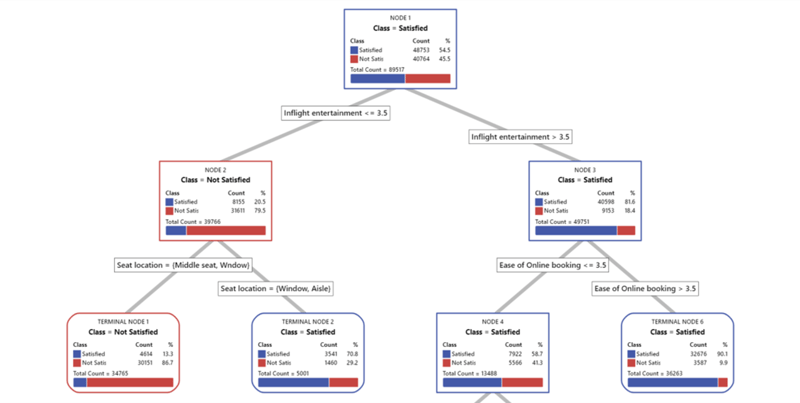
CART trees are very useful when you want to understand the important variables, but they also make it easy for anyone to explore the variables by viewing the split values in the model. Using the tree above, airlines probably will not be too surprised to learn that customers want good inflight entertainment and a comfortable seat — but knowing that even if the inflight entertainment is not great, they can keep passengers satisfied with a comfortable seat — is an important insight.
CART is useful tool for your analytics toolbox as it does not require many assumptions and can be done quite quickly. If you have data that you have not analyzed because predictive analytics and machine learning seem too intimidating for you — try CART — it is even easier now in the latest release of Minitab Statistical Software.
Want more tips and tricks on how to use CART® in Minitab?